A full-featured spreadsheet. And so much more.
Equals has the features you expect from a spreadsheet. And the features you’ve always wanted in a spreadsheet. Killer.
The Greatest Hits
Query
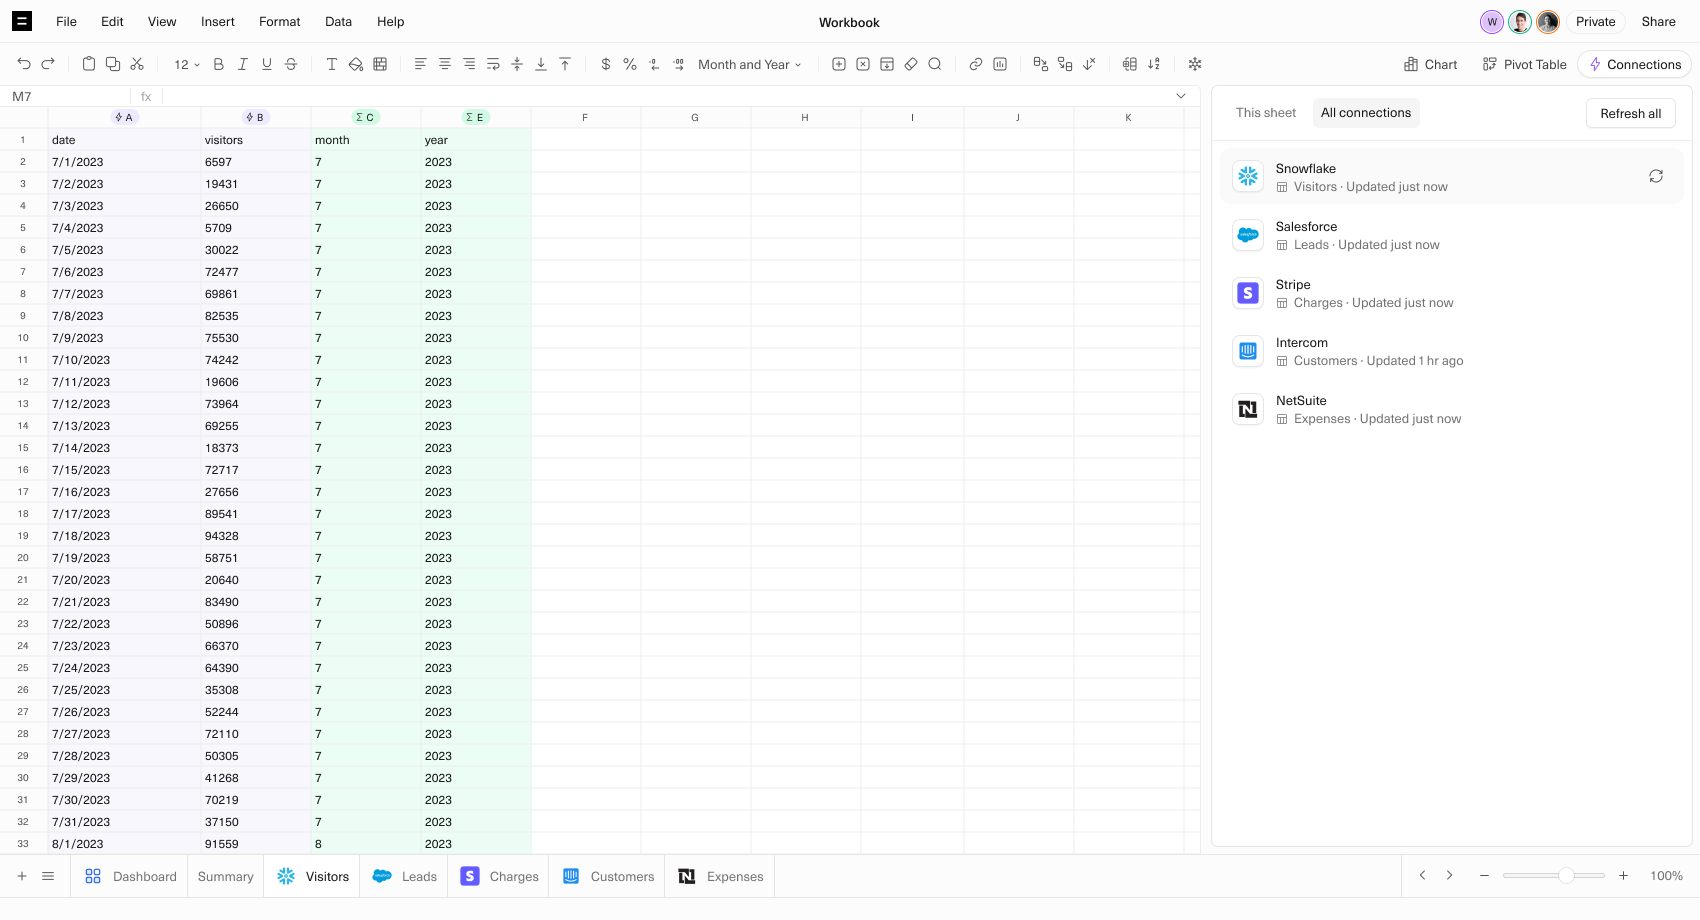
Equals connects directly to your databases, data warehouses and popular cloud apps. Connect today and query away.
Learn More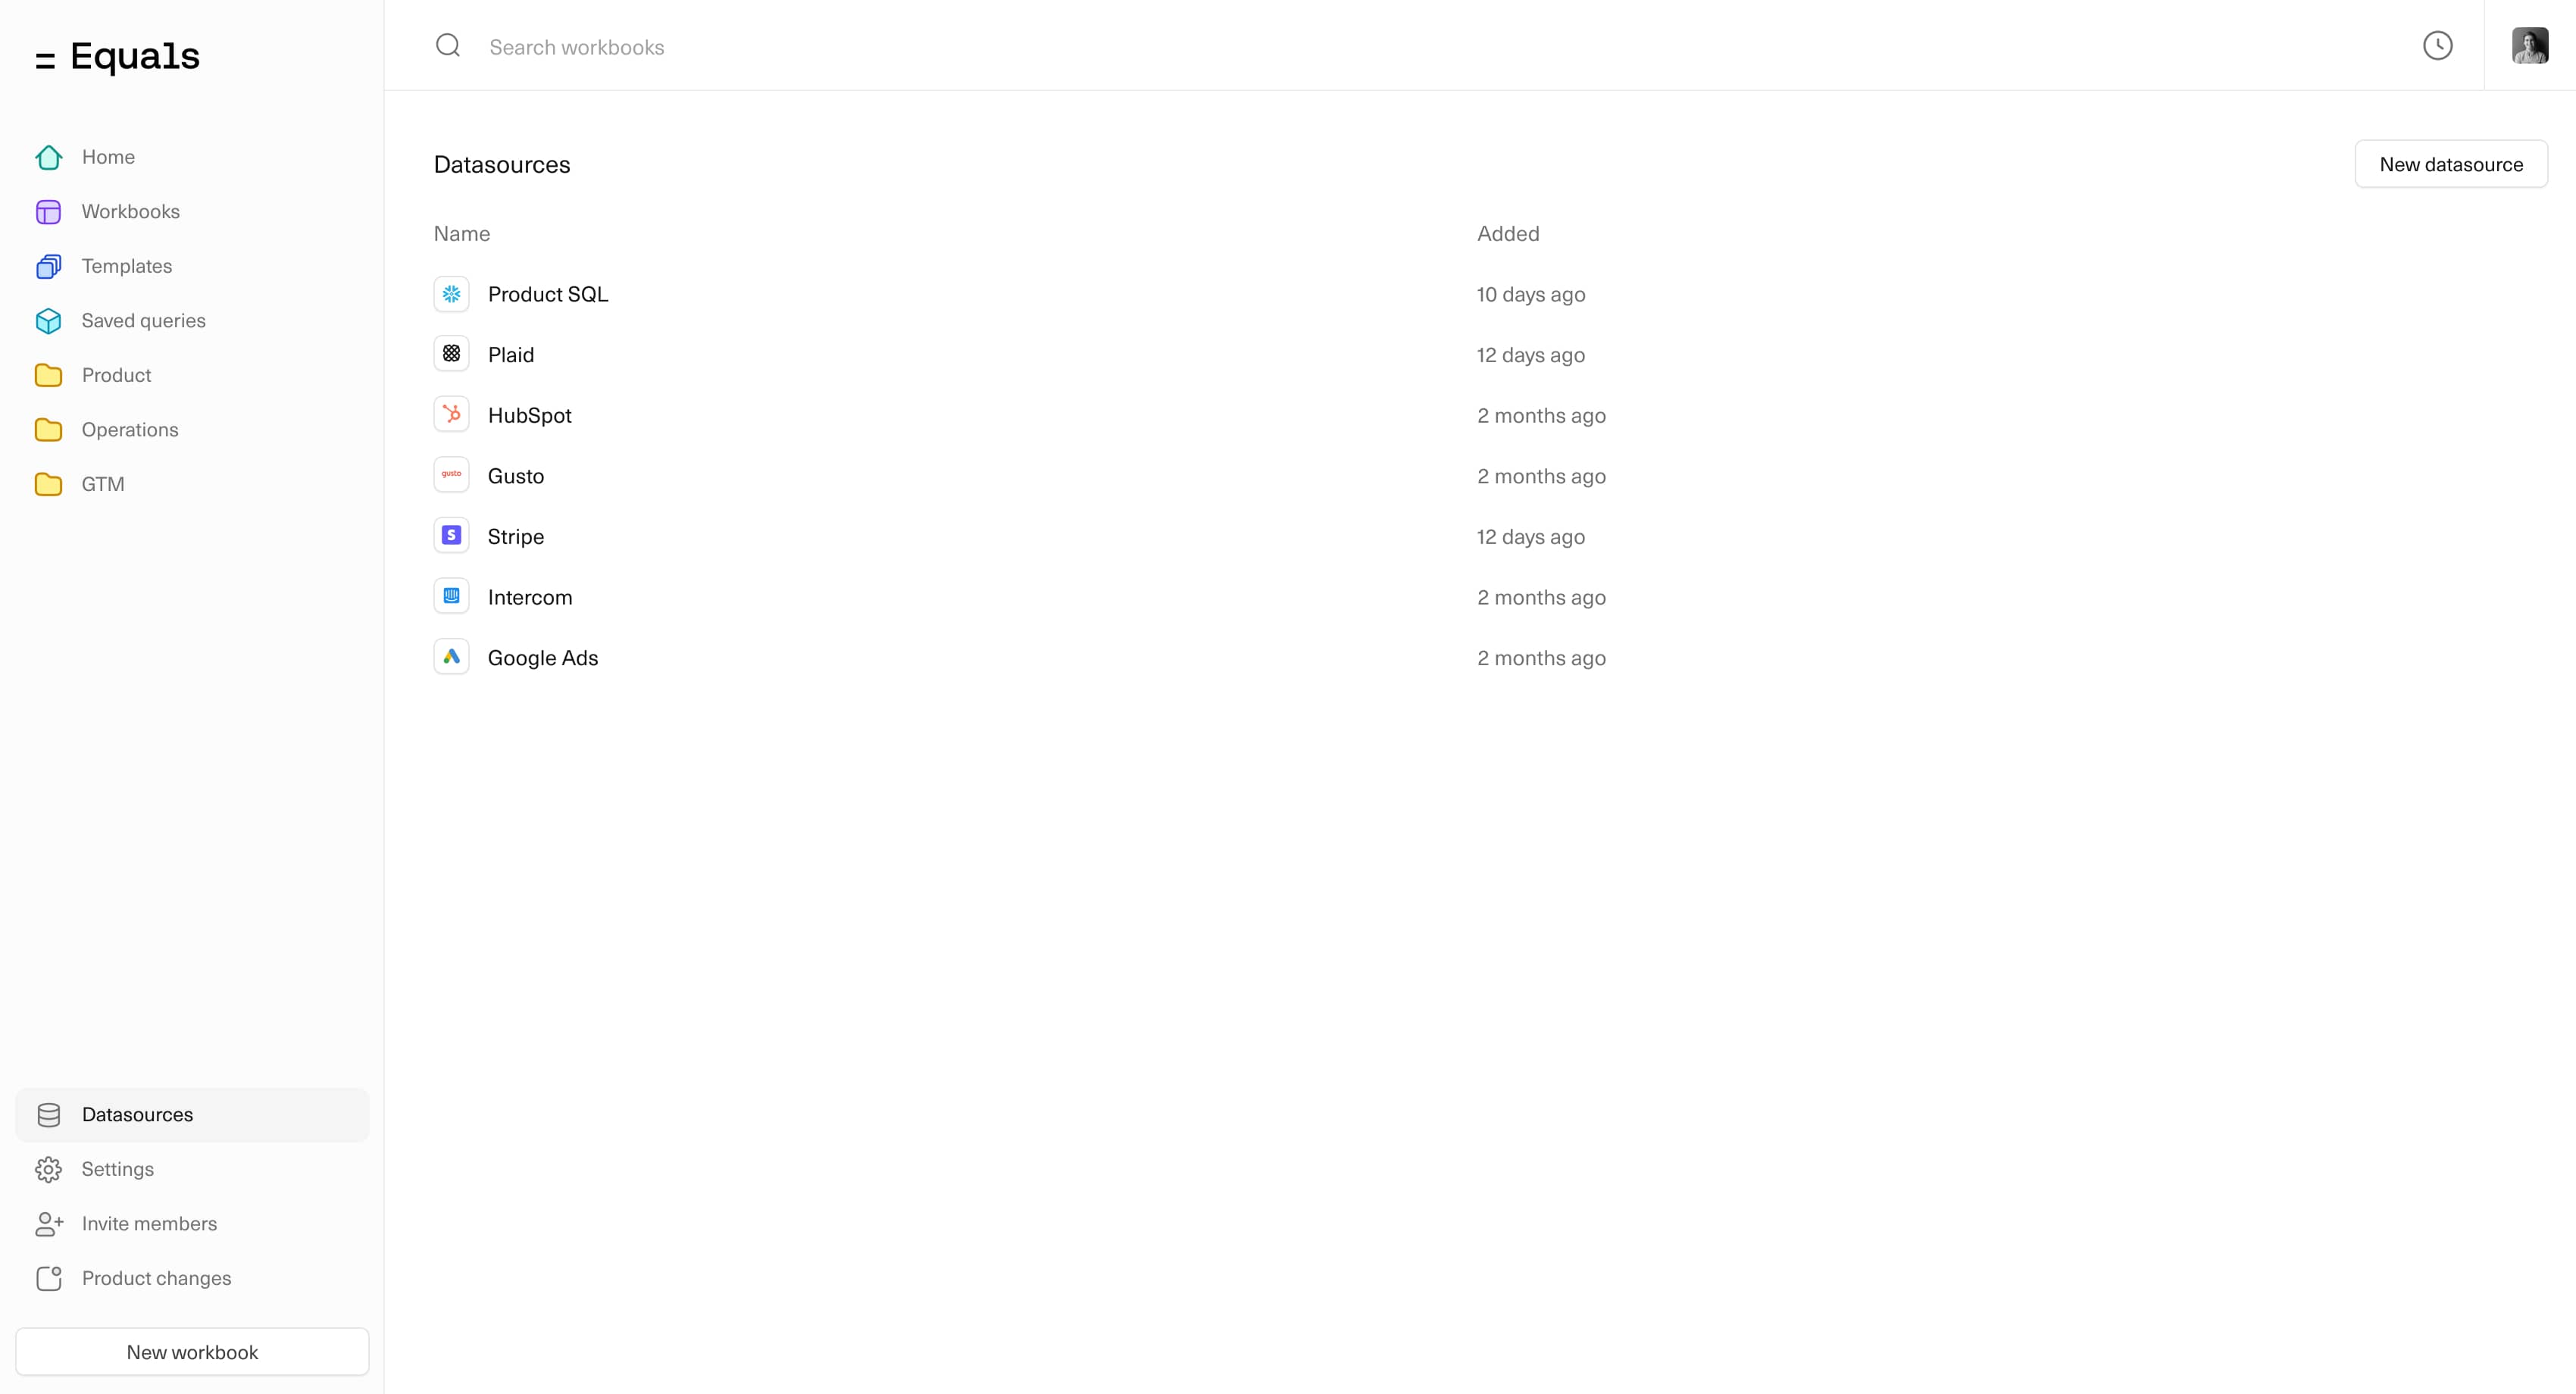
Datasources
Connect directly to PostgreSQL, Snowflake, Stripe, QuickBooks, and more than 20 other sources.
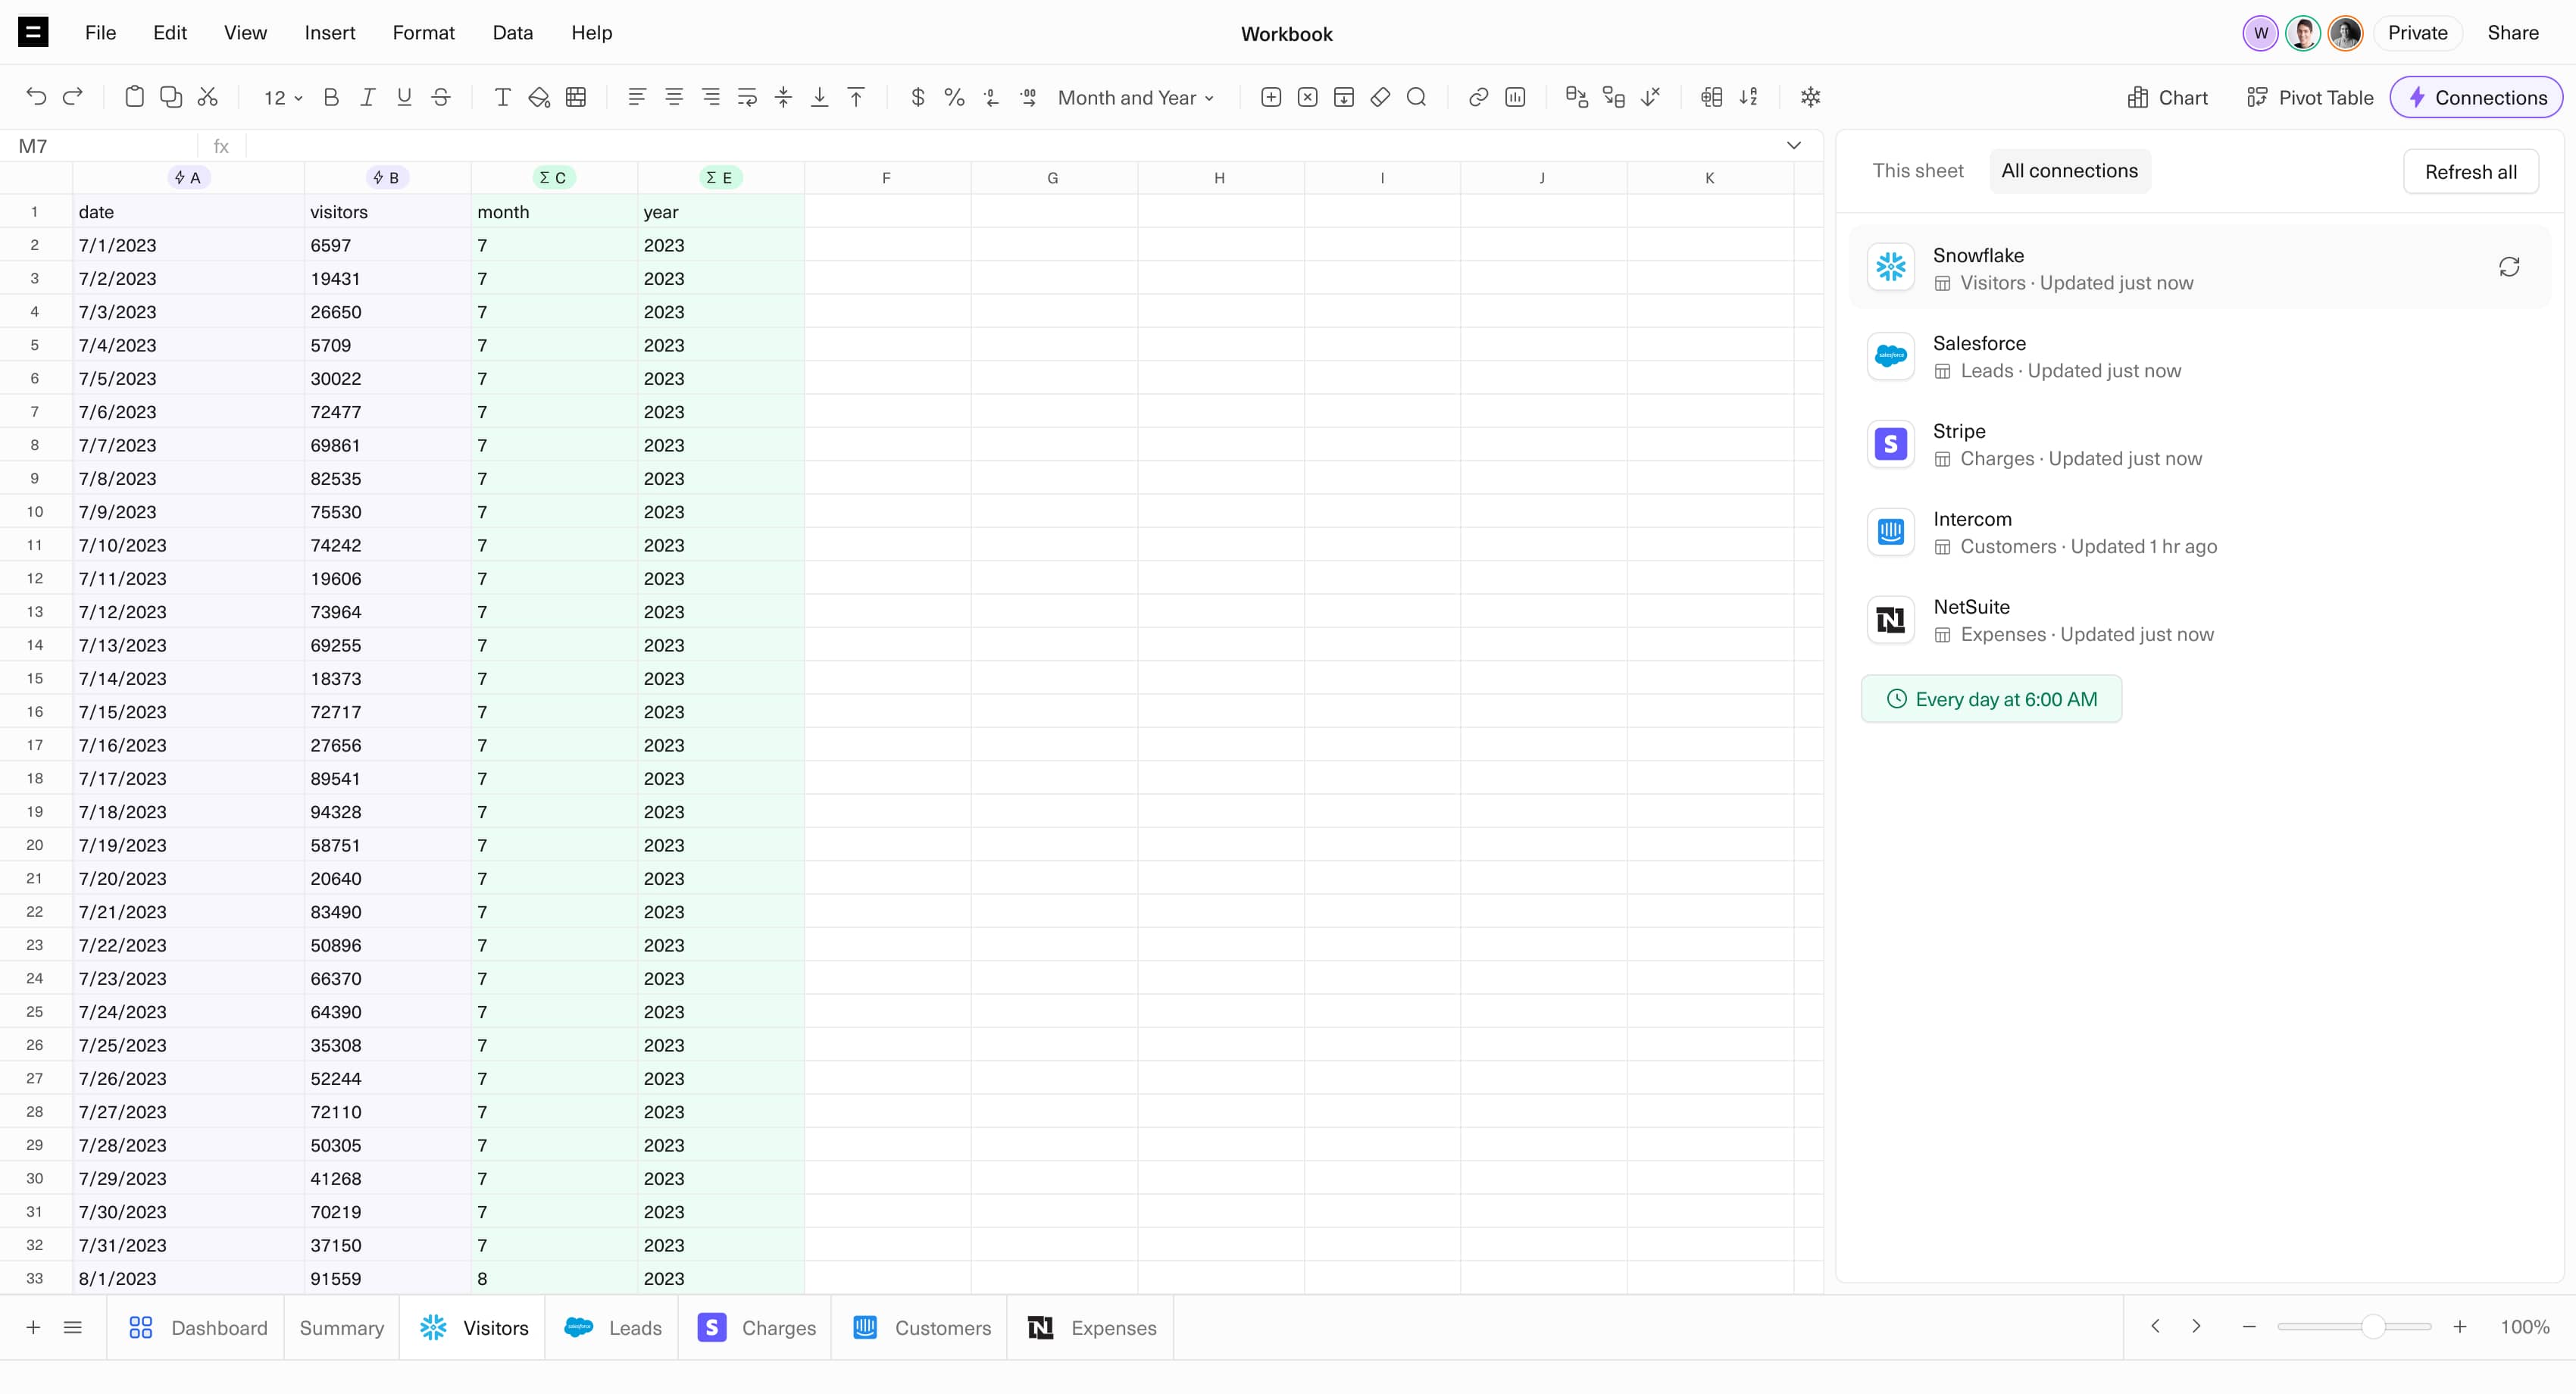
Connections
Create connections to your datasources to query and import data directly into your spreadhseet.
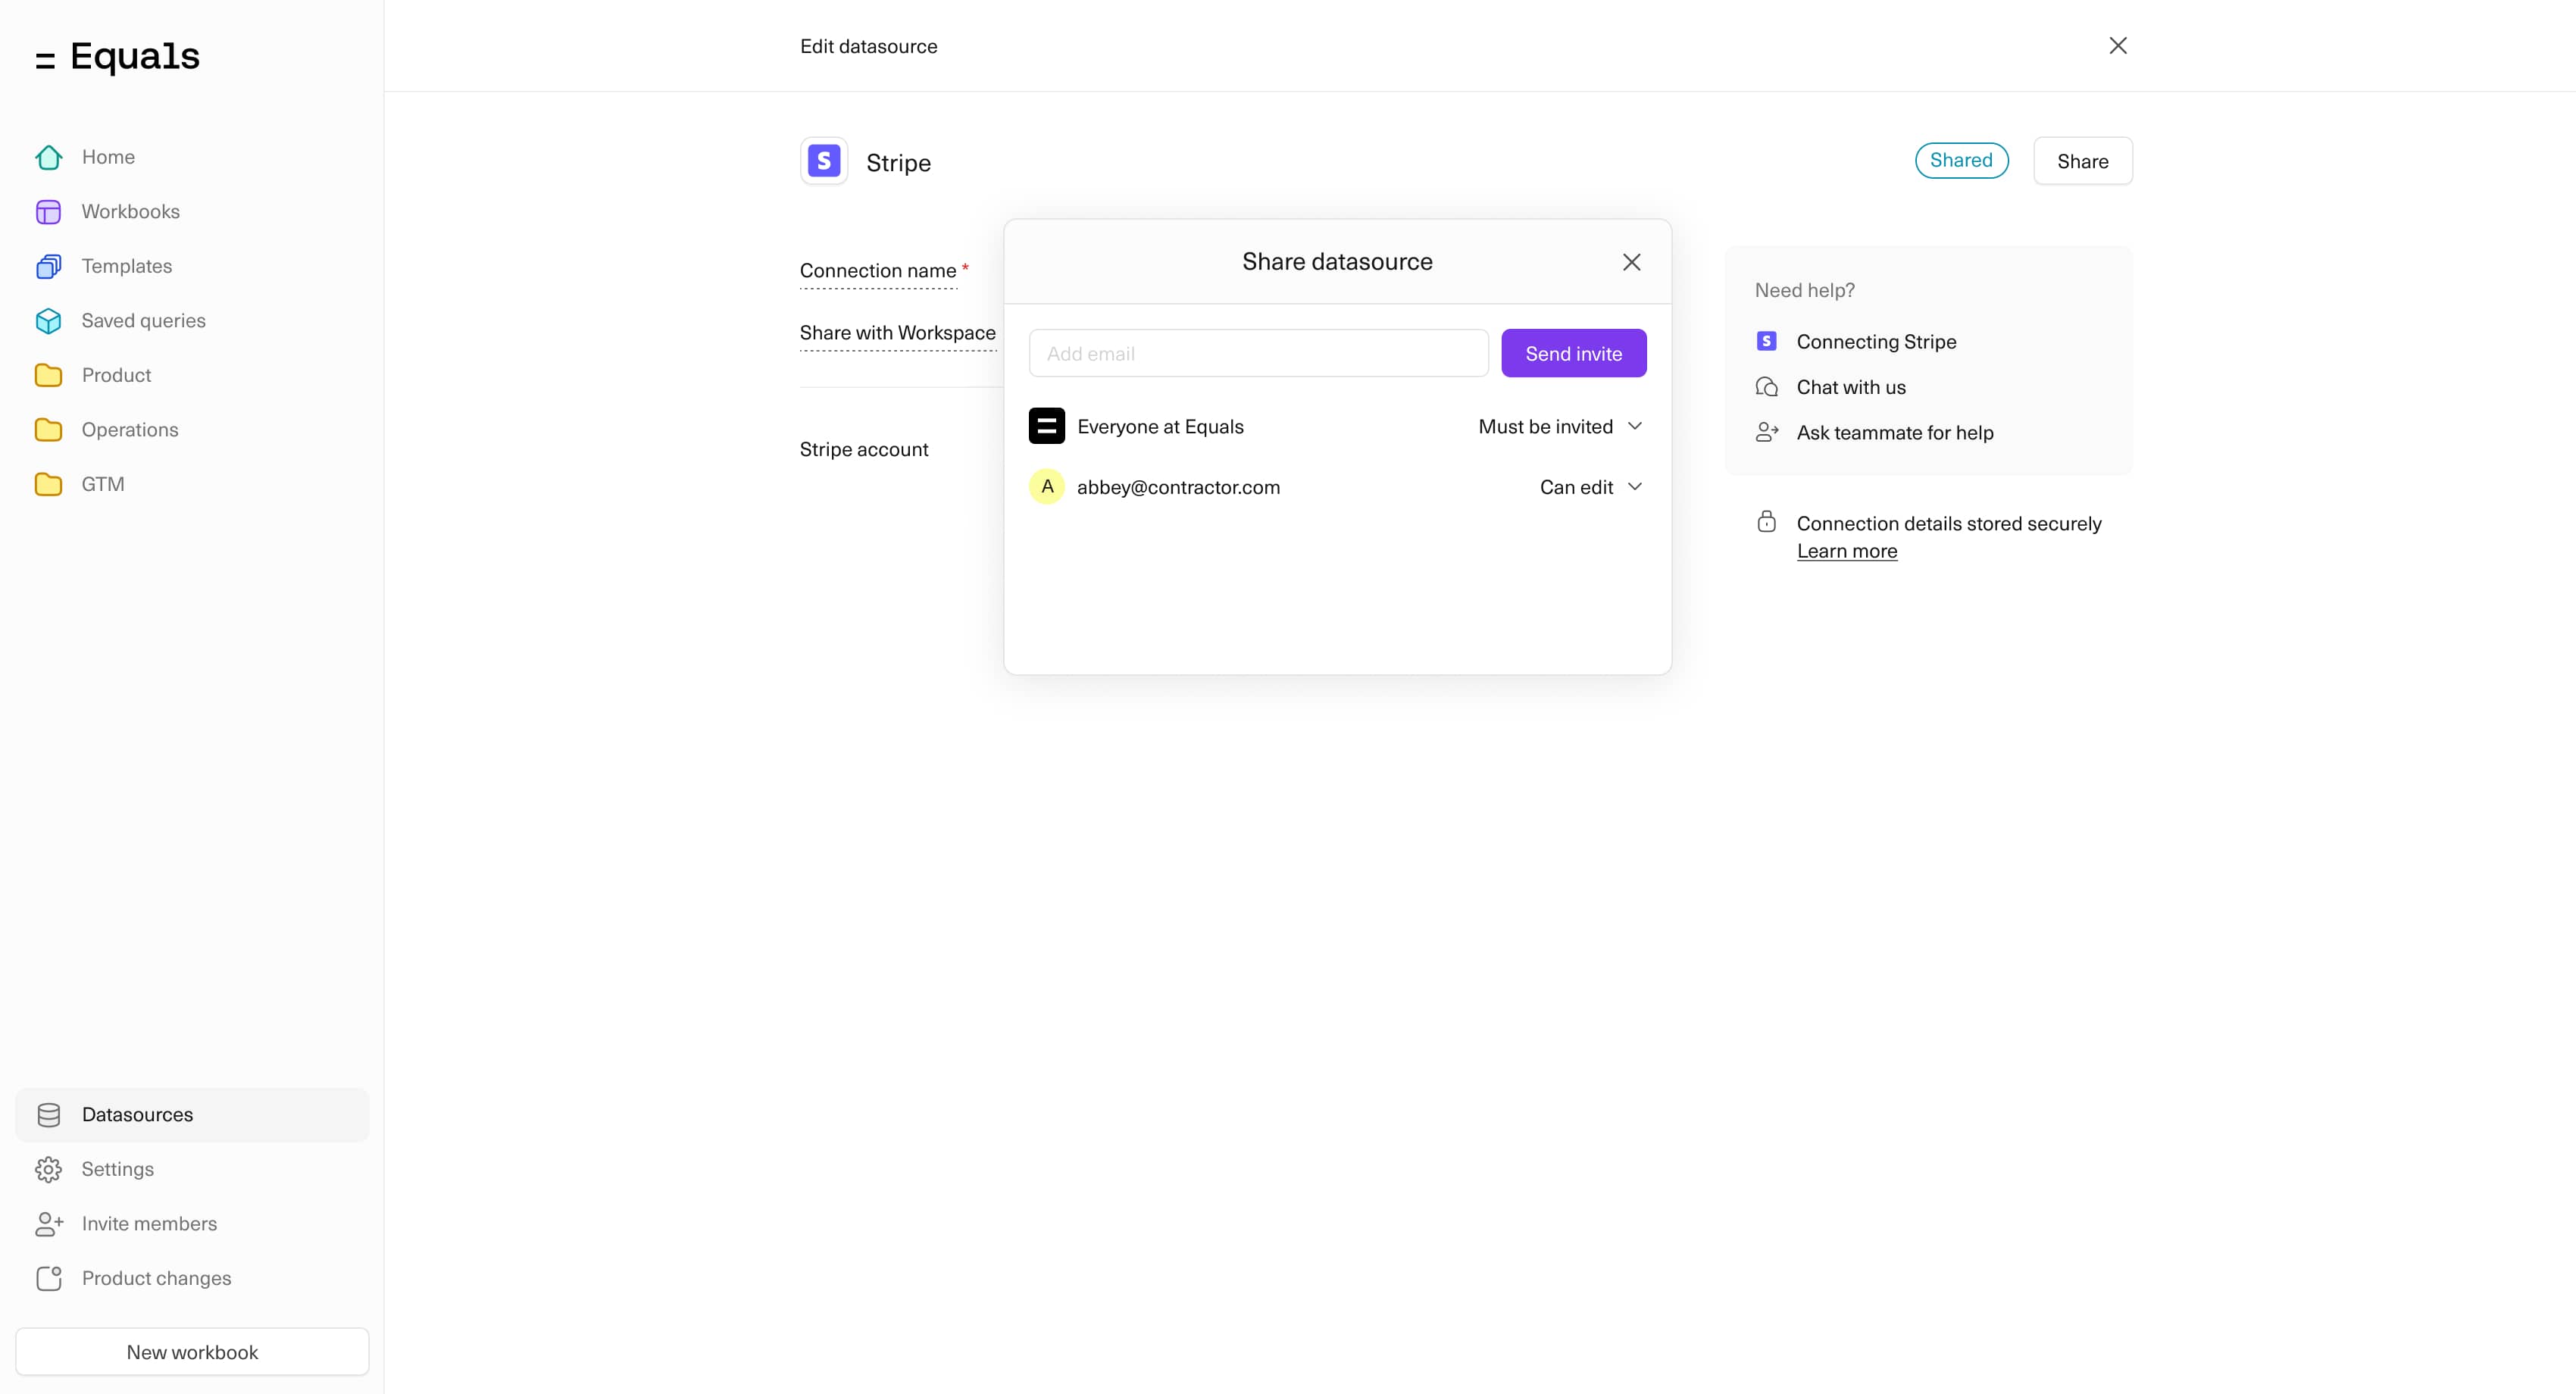
Datasource Permissions
Control who can create connections to and query your datasources.
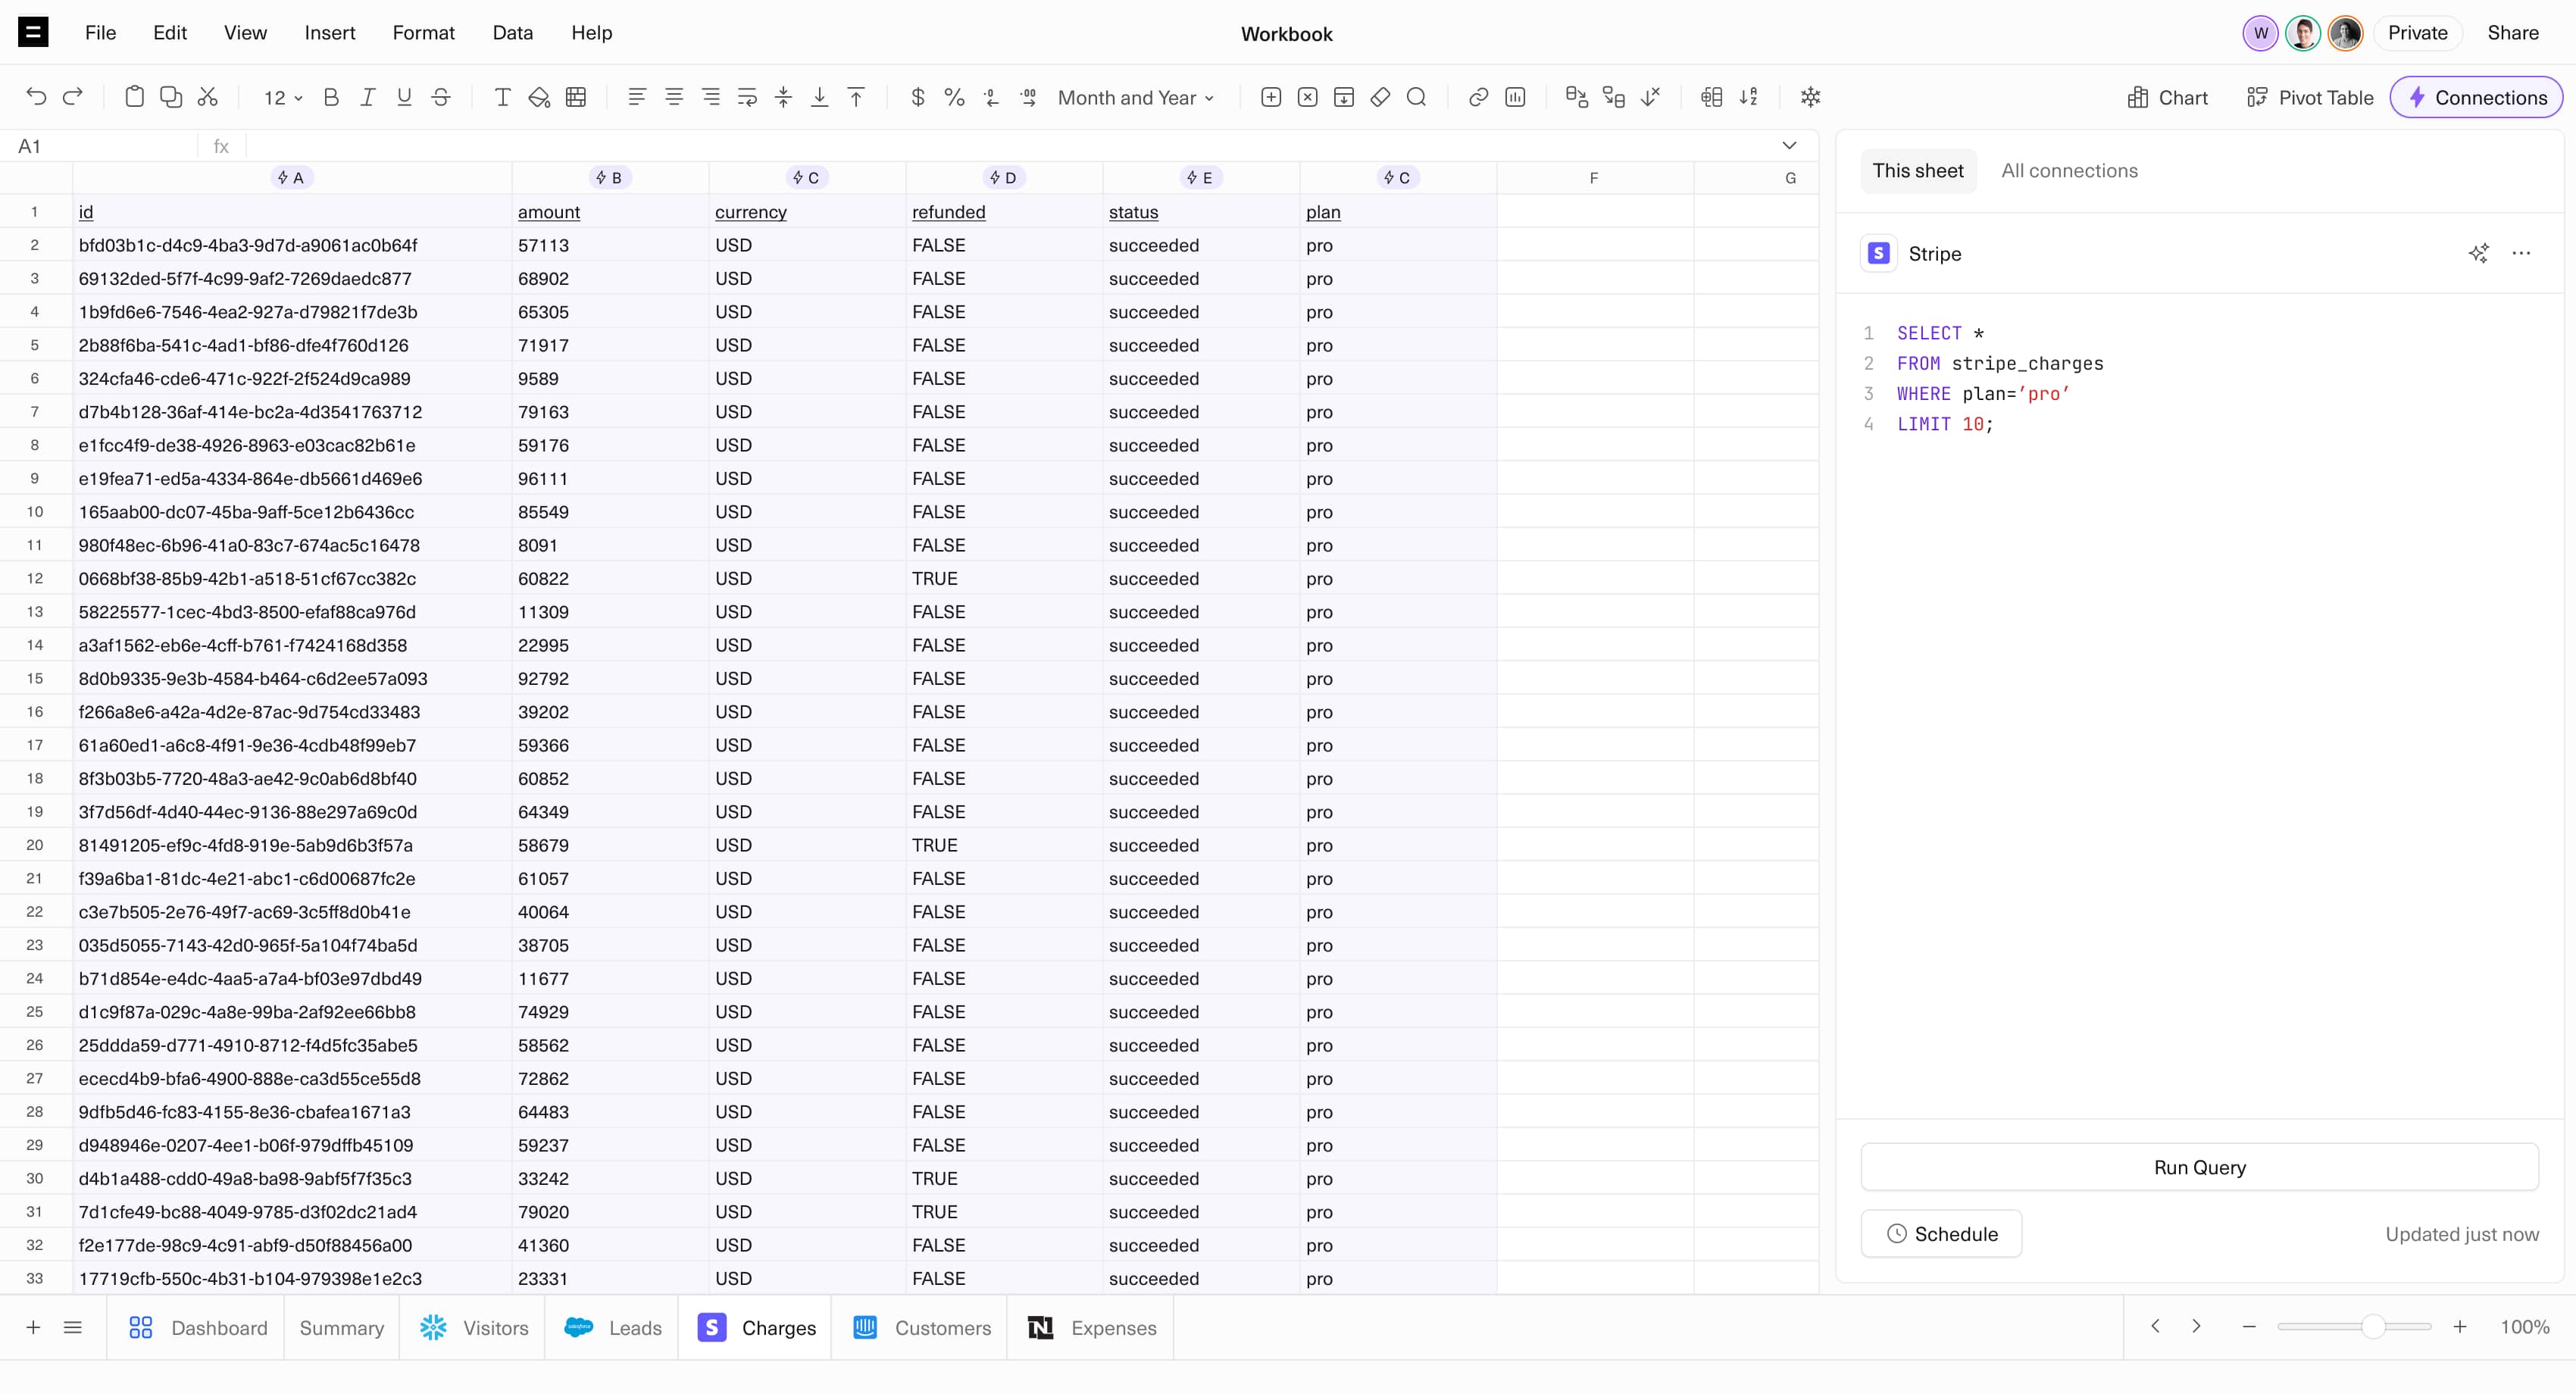
SQL Editor
Write and modify queries directly from your workbooks with a table browser and auto-complete.
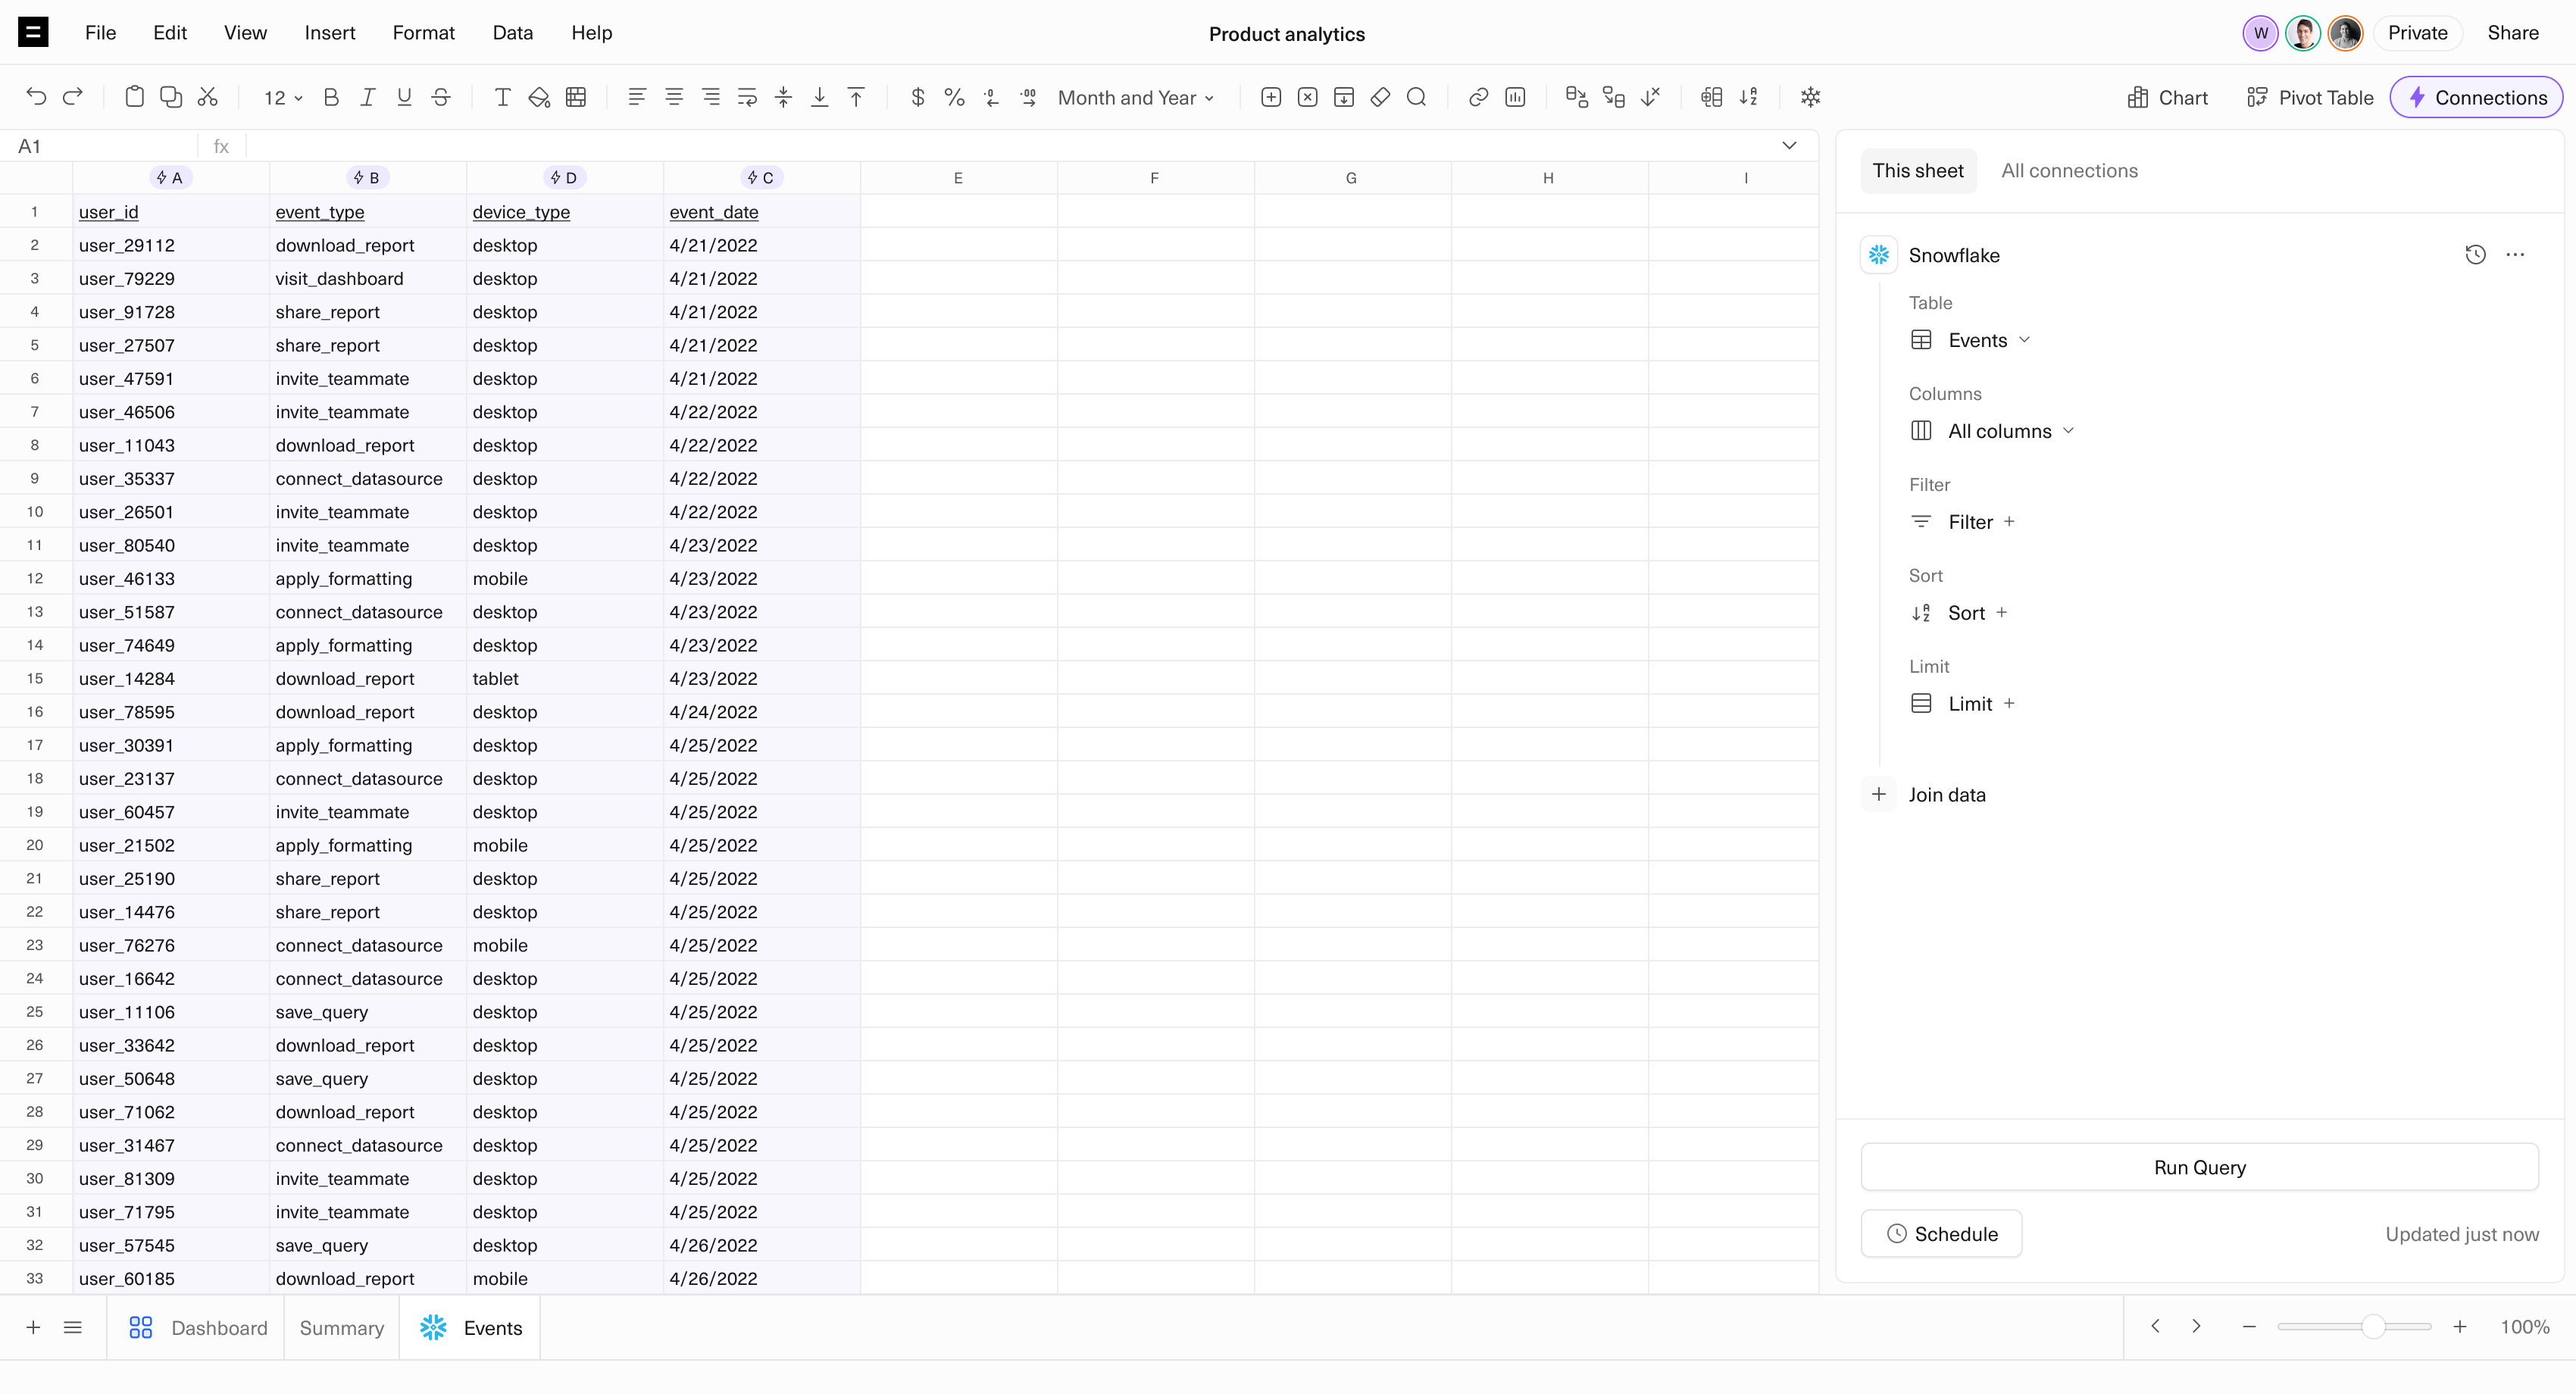
Query Builder
Build simple or complex queries without needing to know SQL.
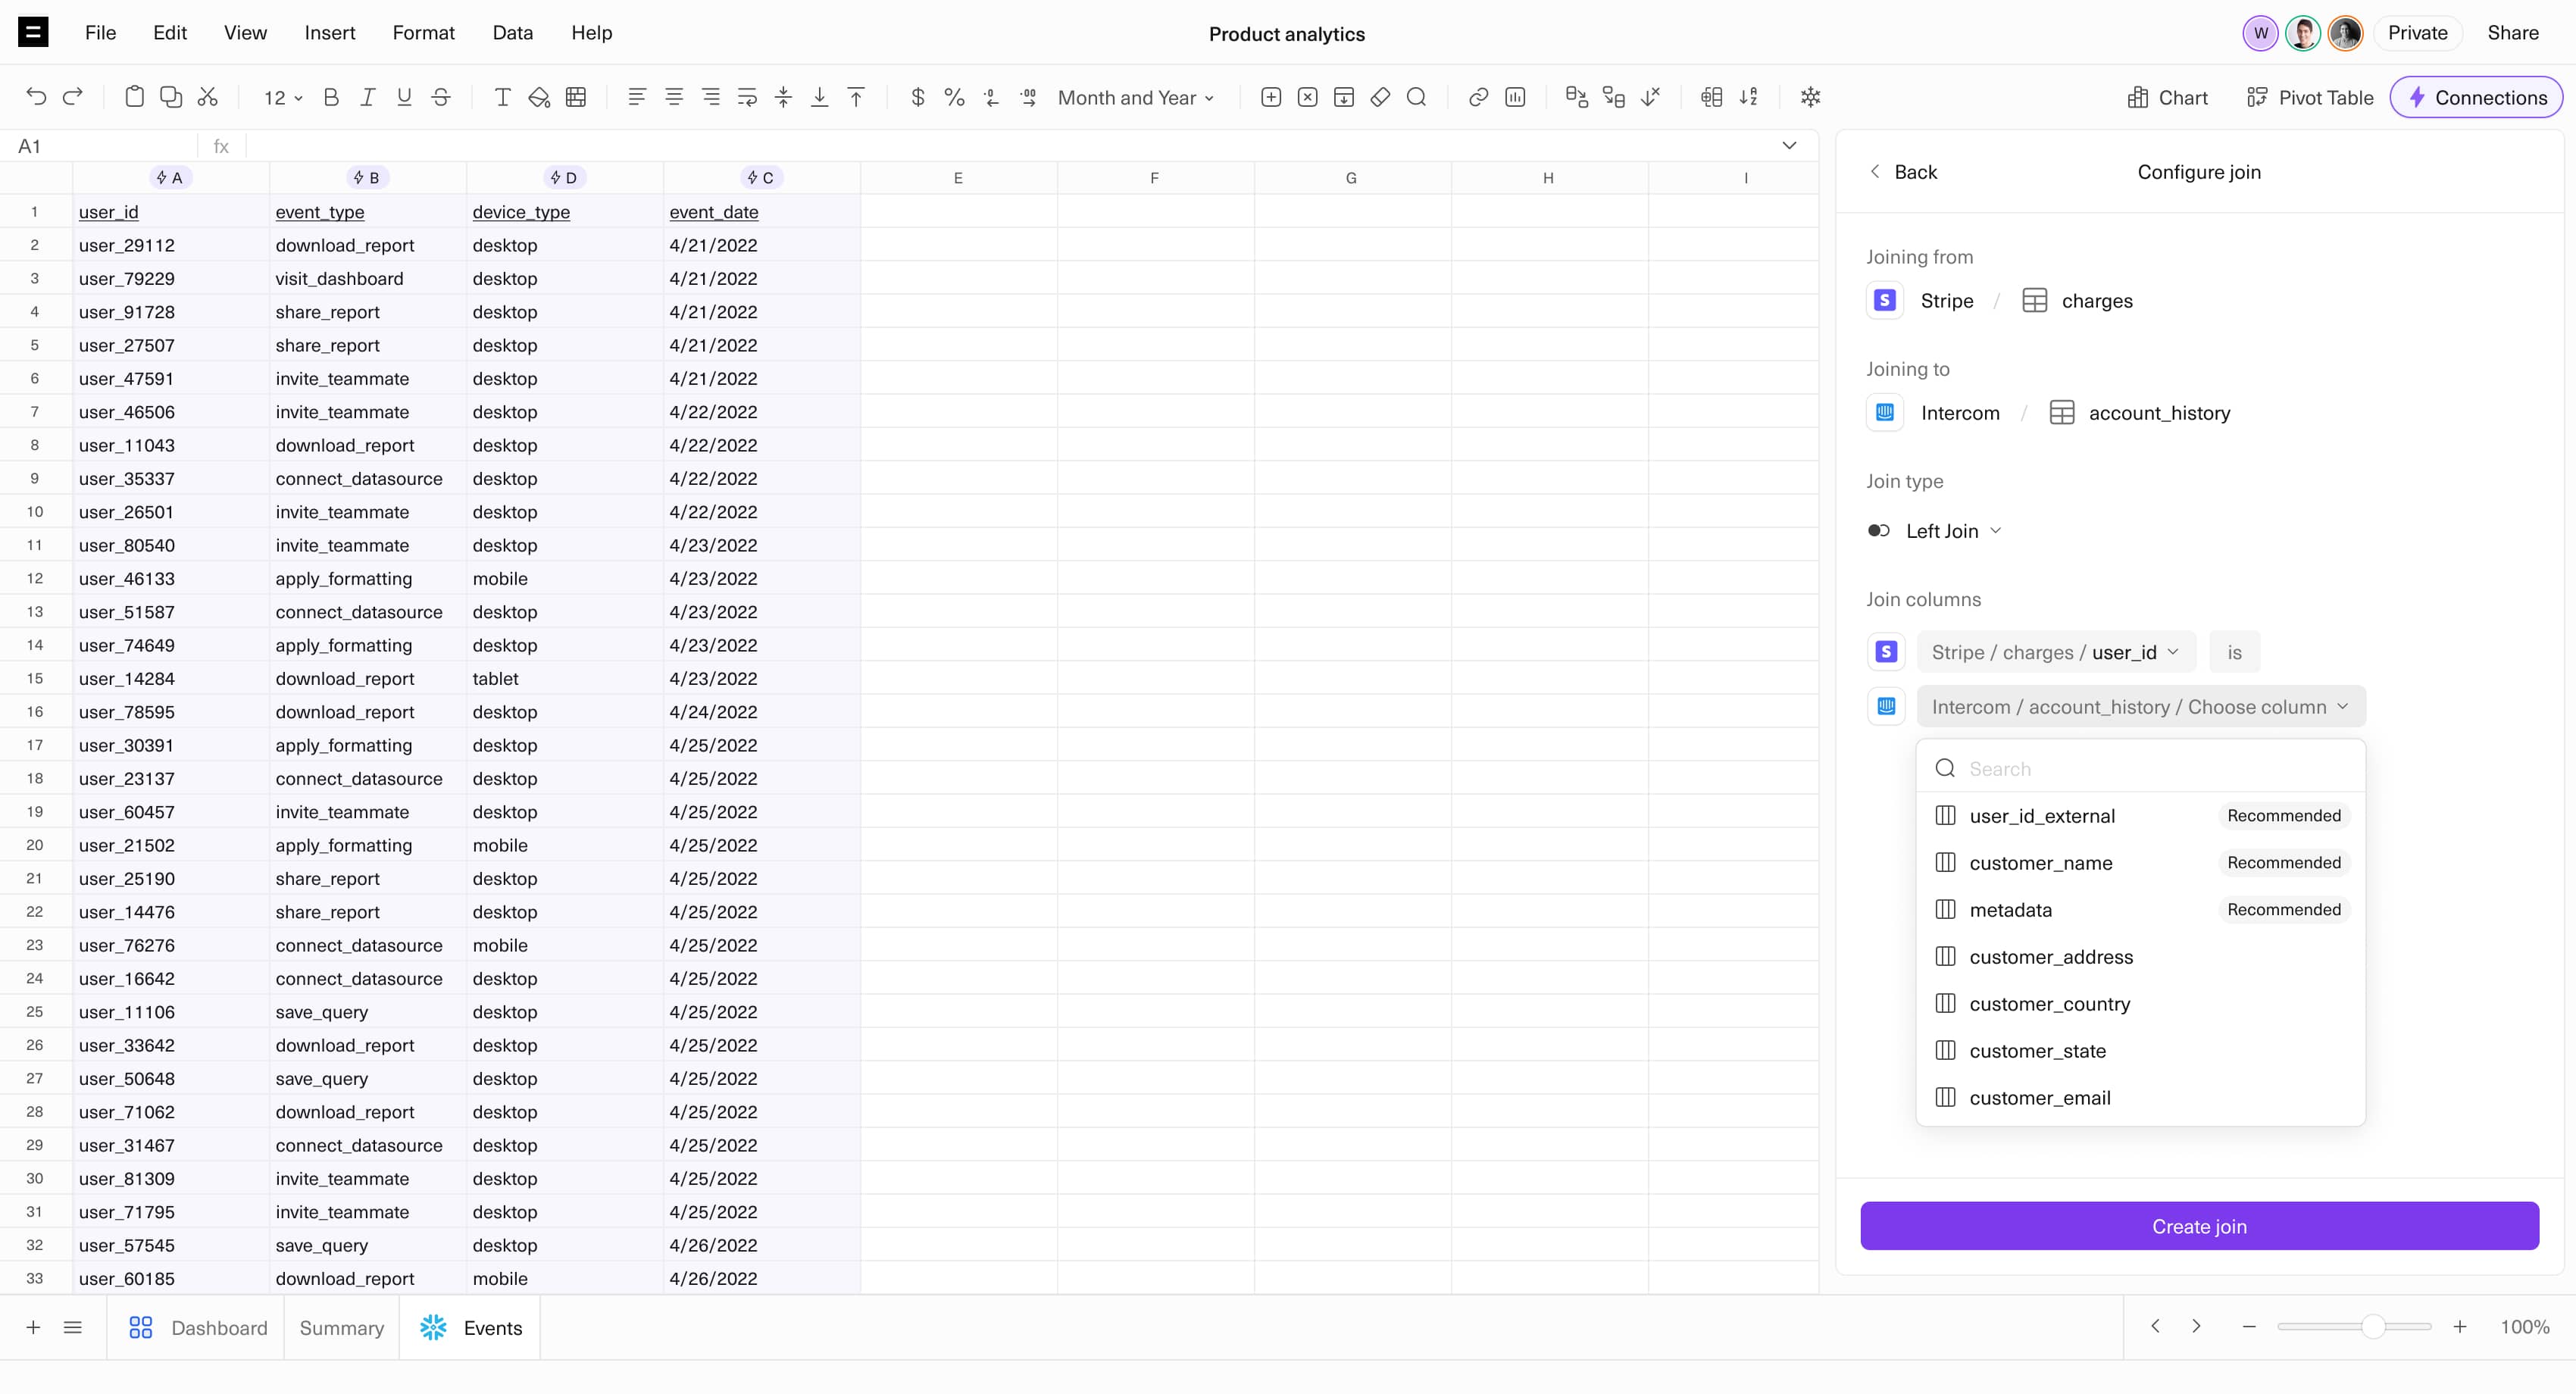
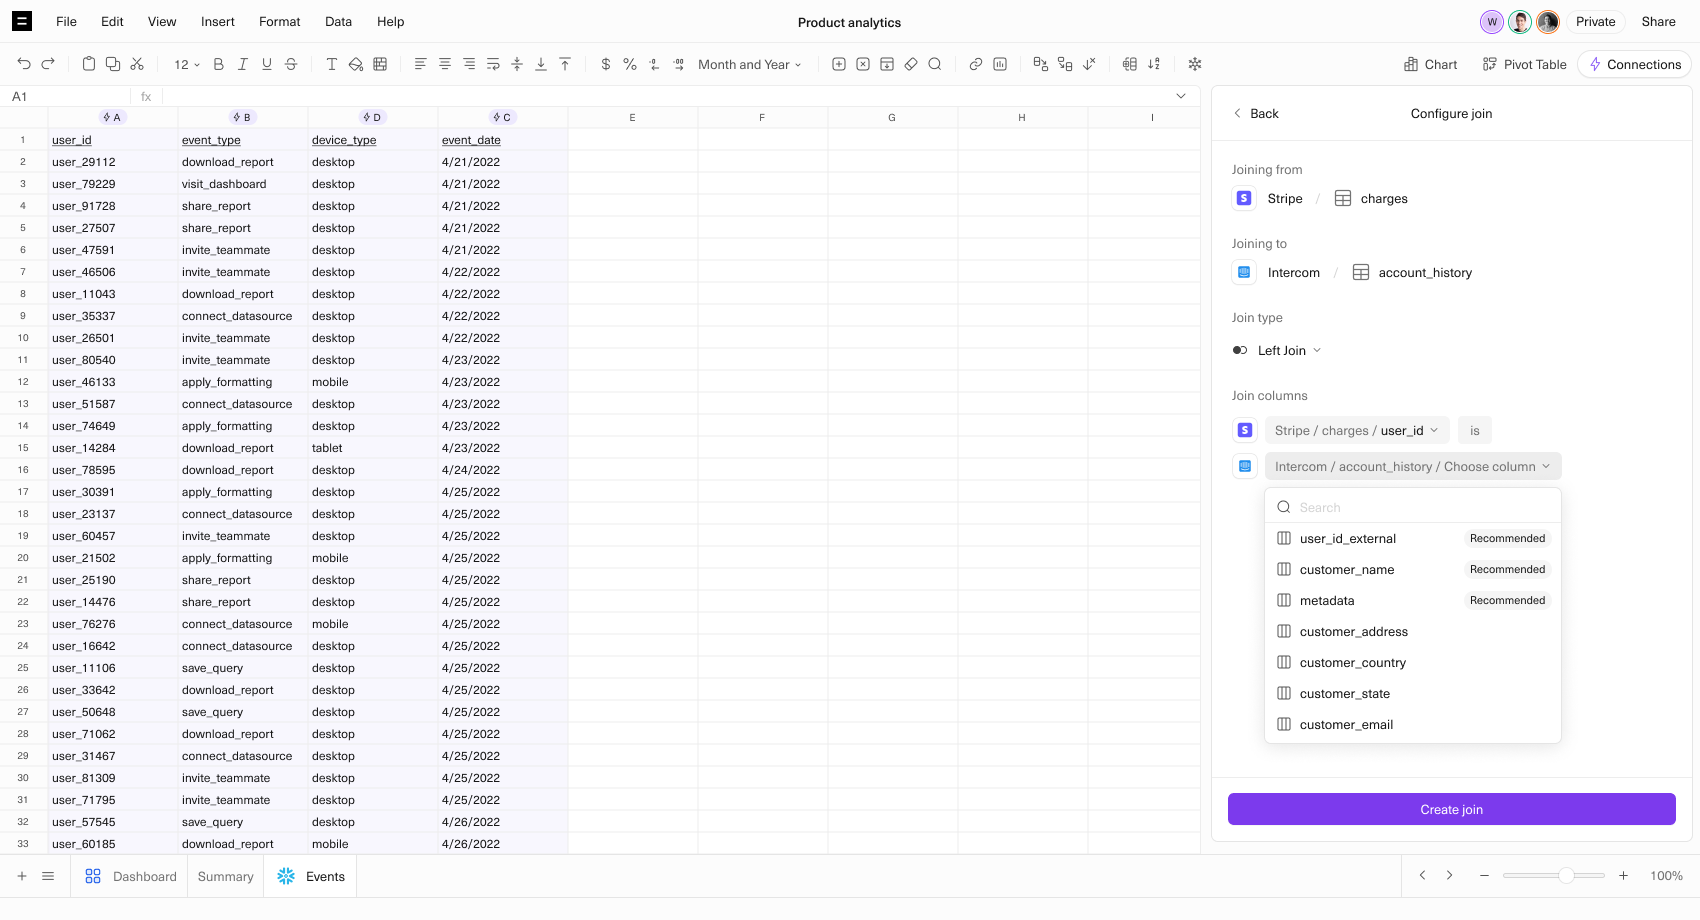
Query Joins
Pull and join data from multiple datasources, like Snowflake and Stripe, in a single query.
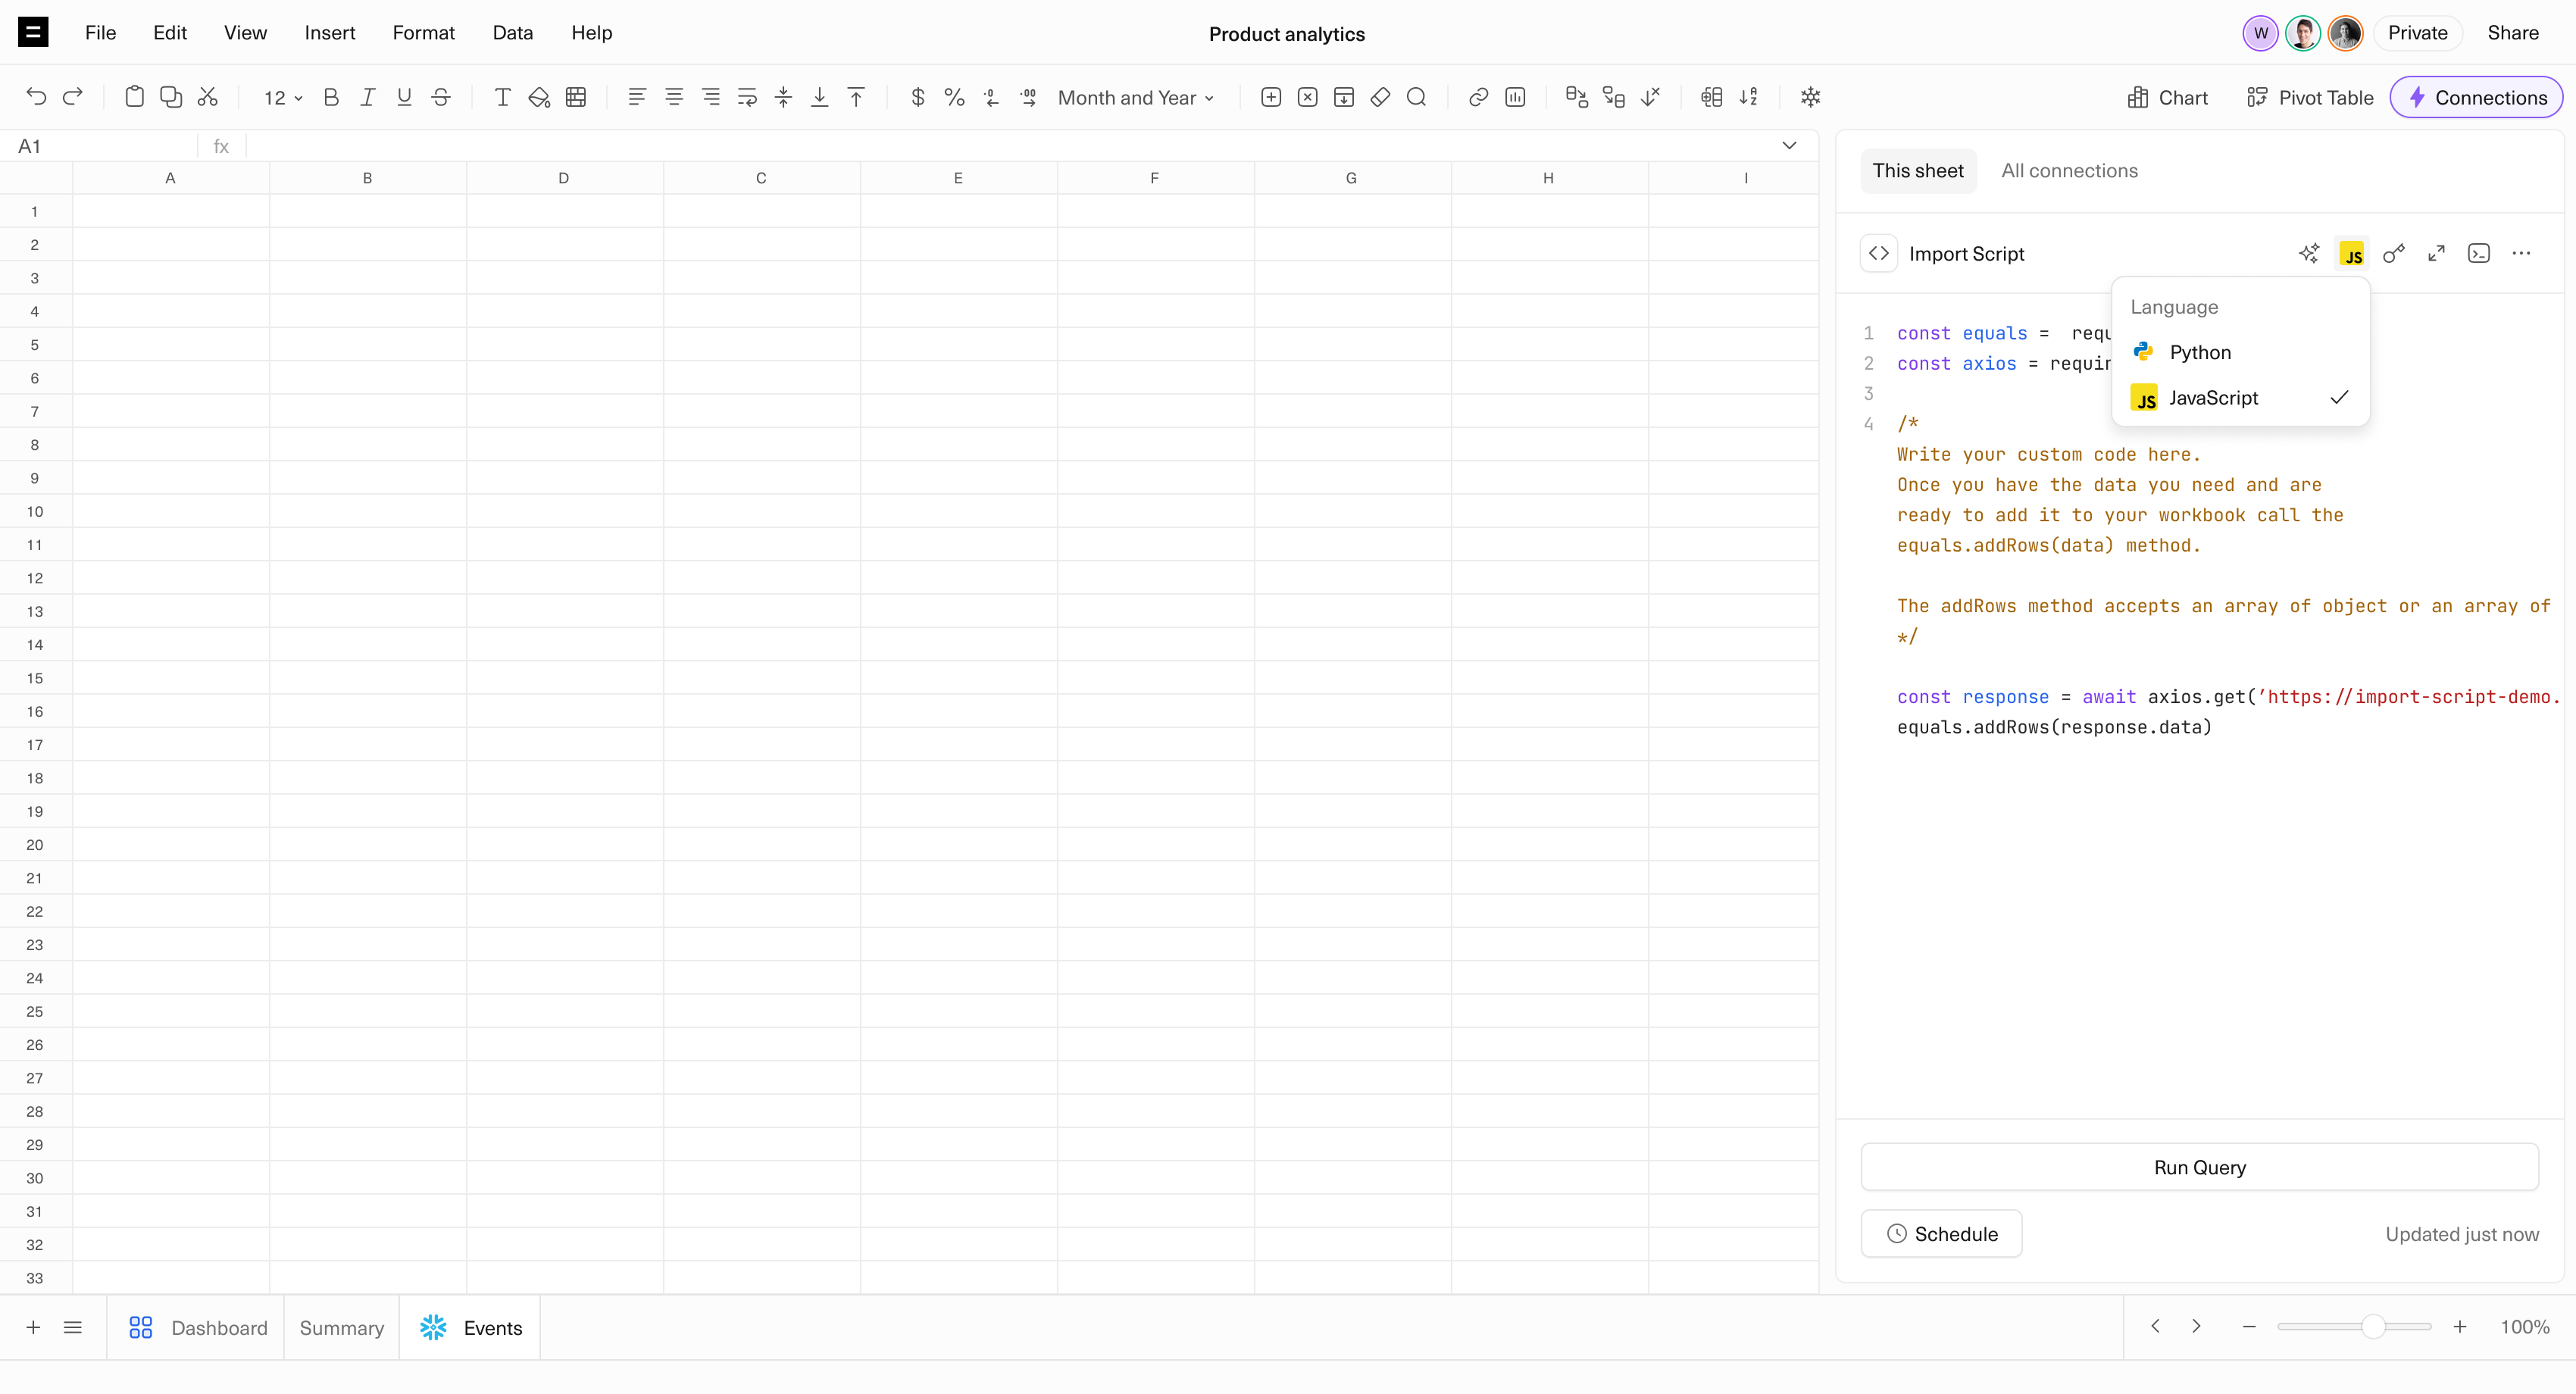
Import Scripts
Import from any API or internal tool with custom Python or Javascript code.
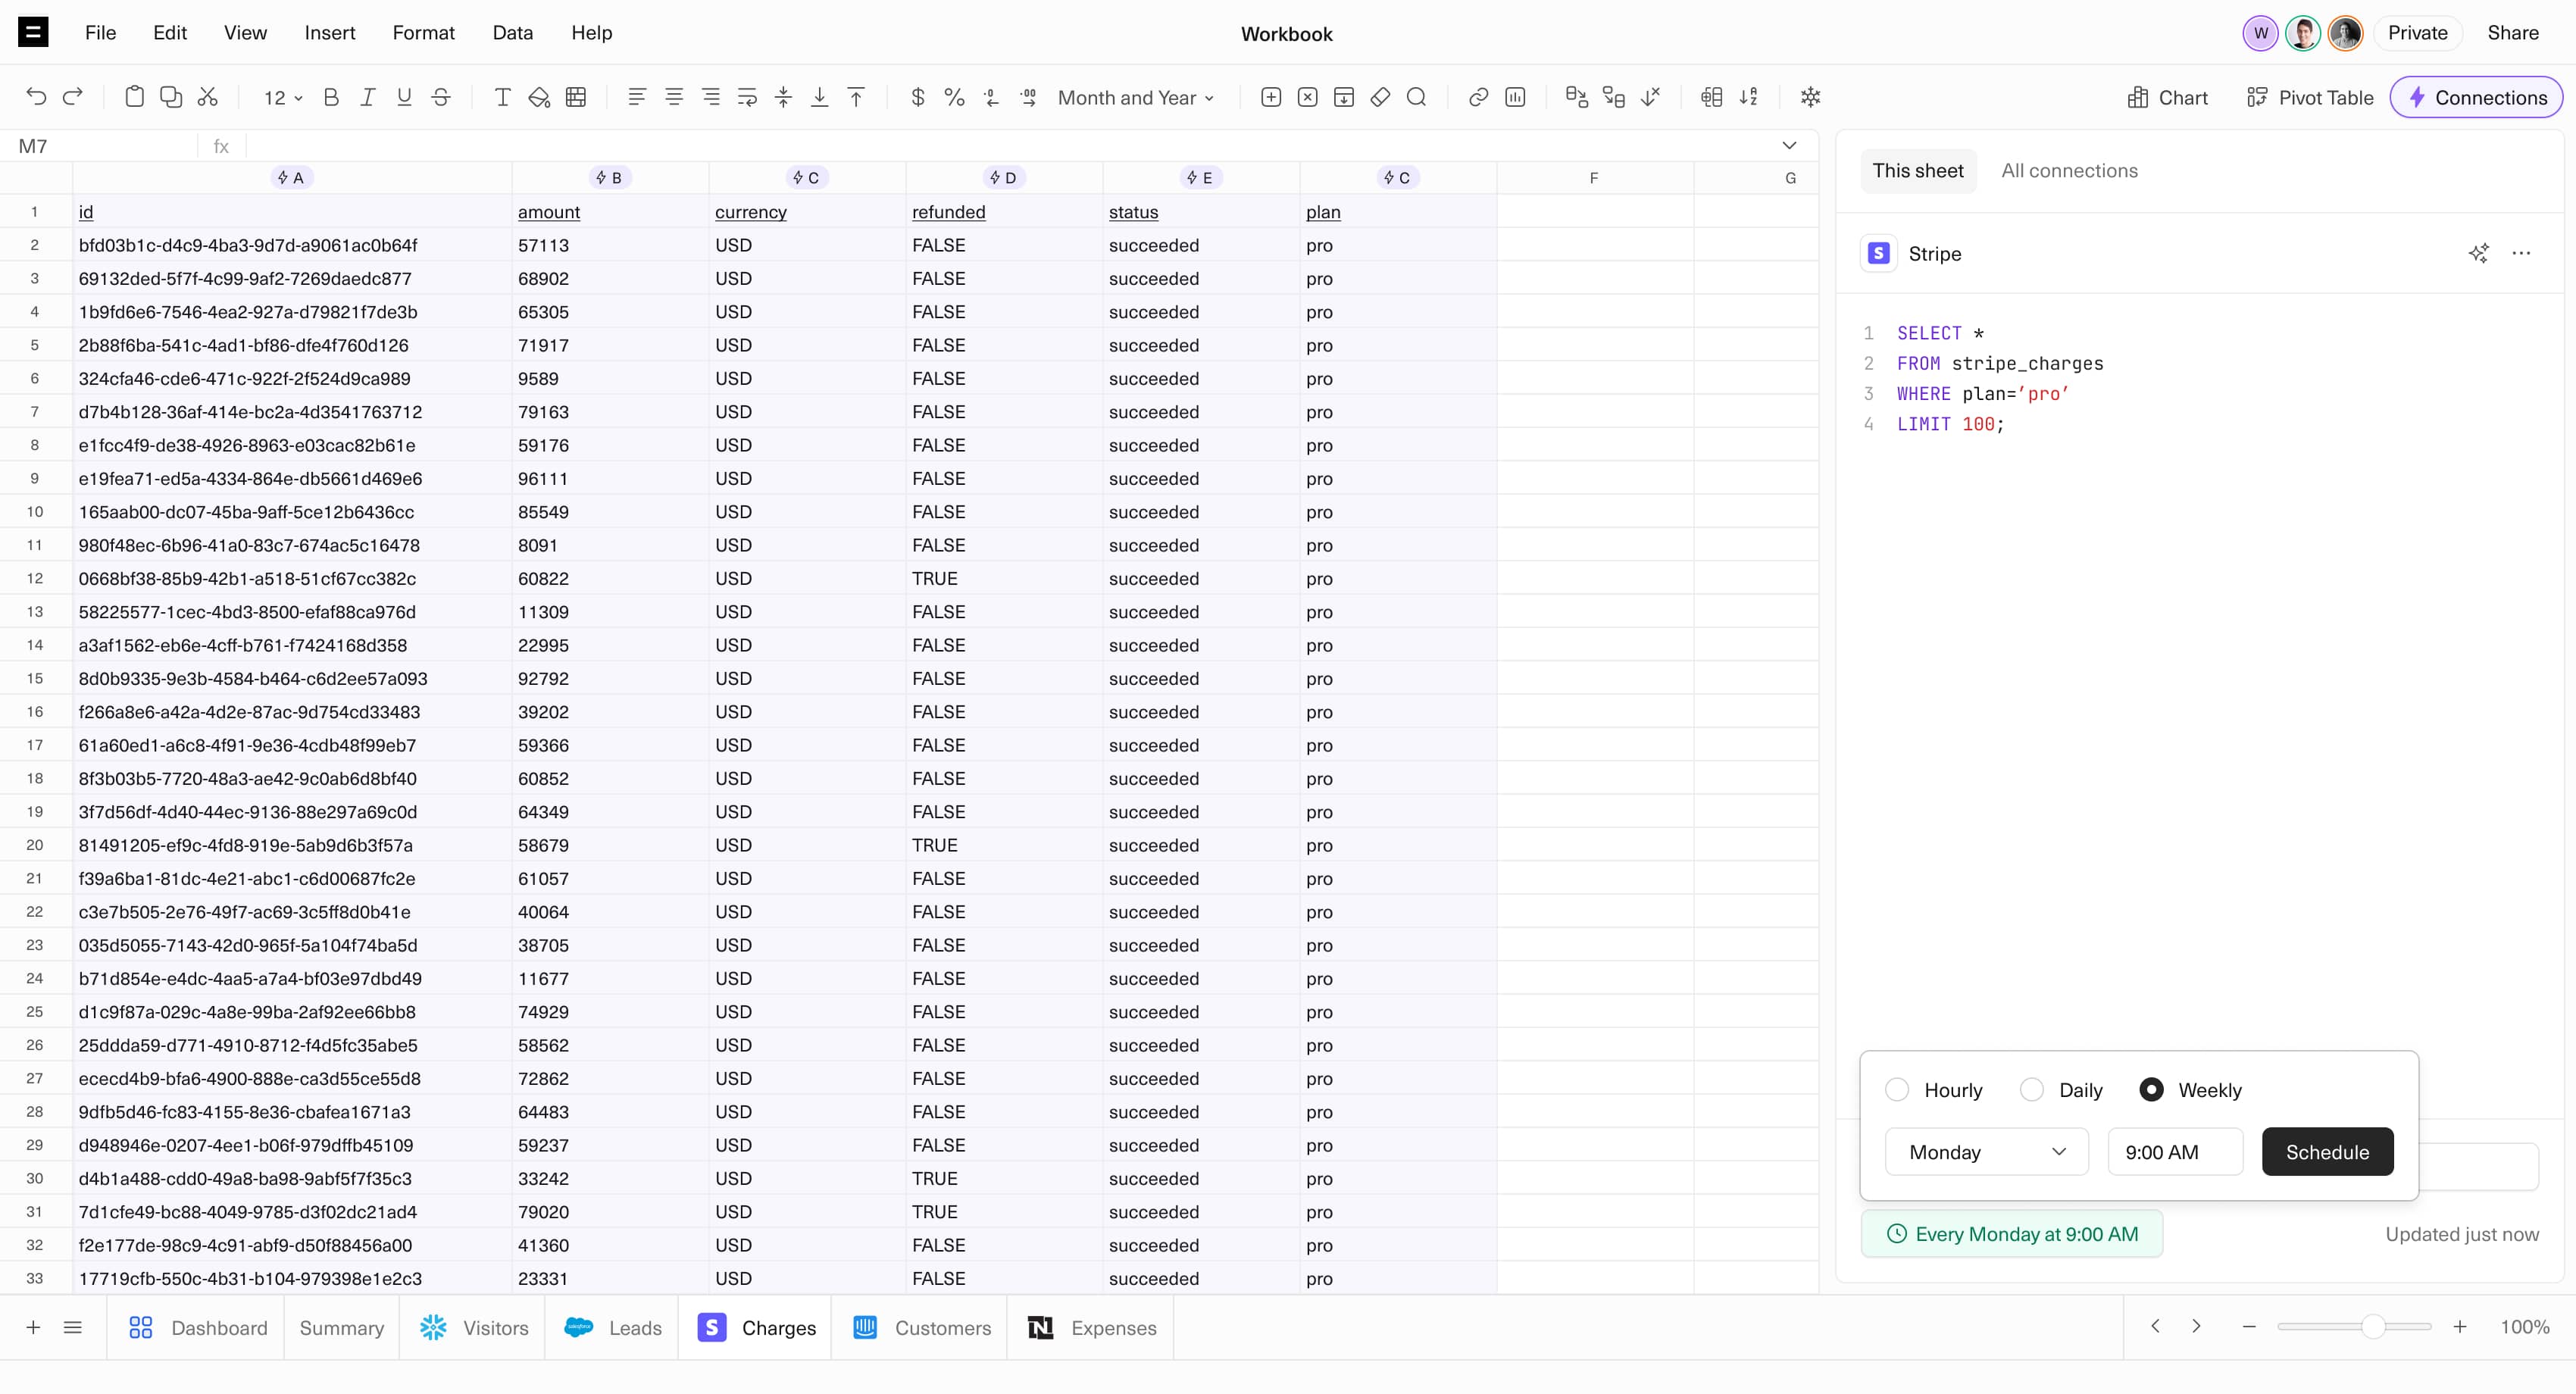
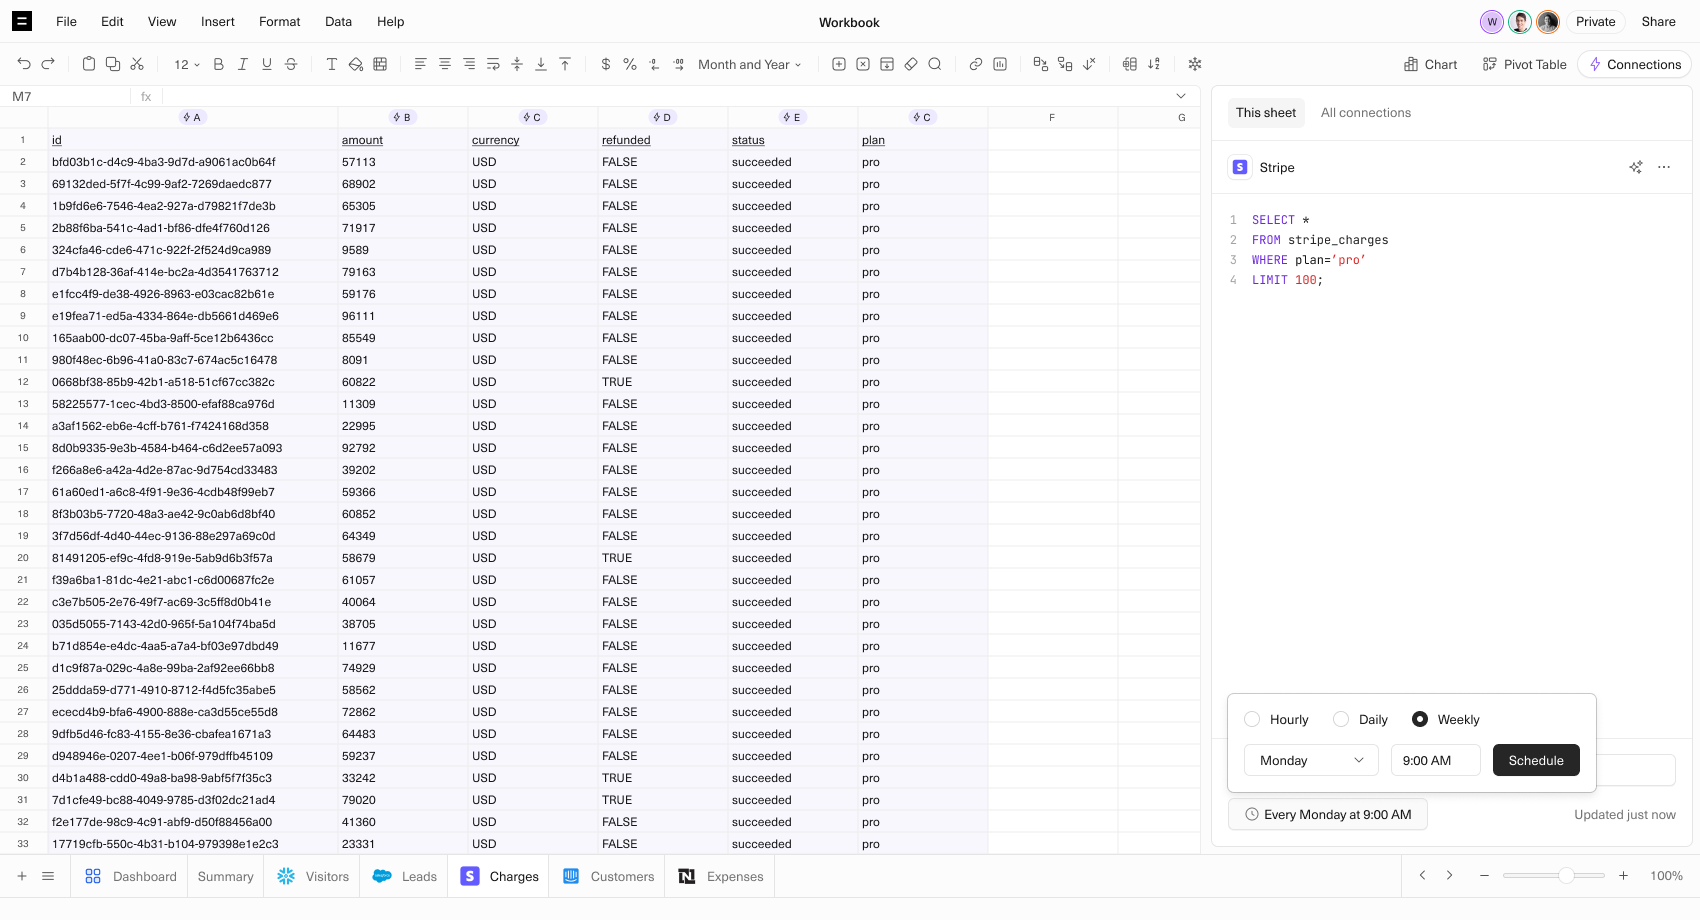
Scheduled Queries
Automate updates to your analyses with daily, weekly, or hourly scheduled queries.
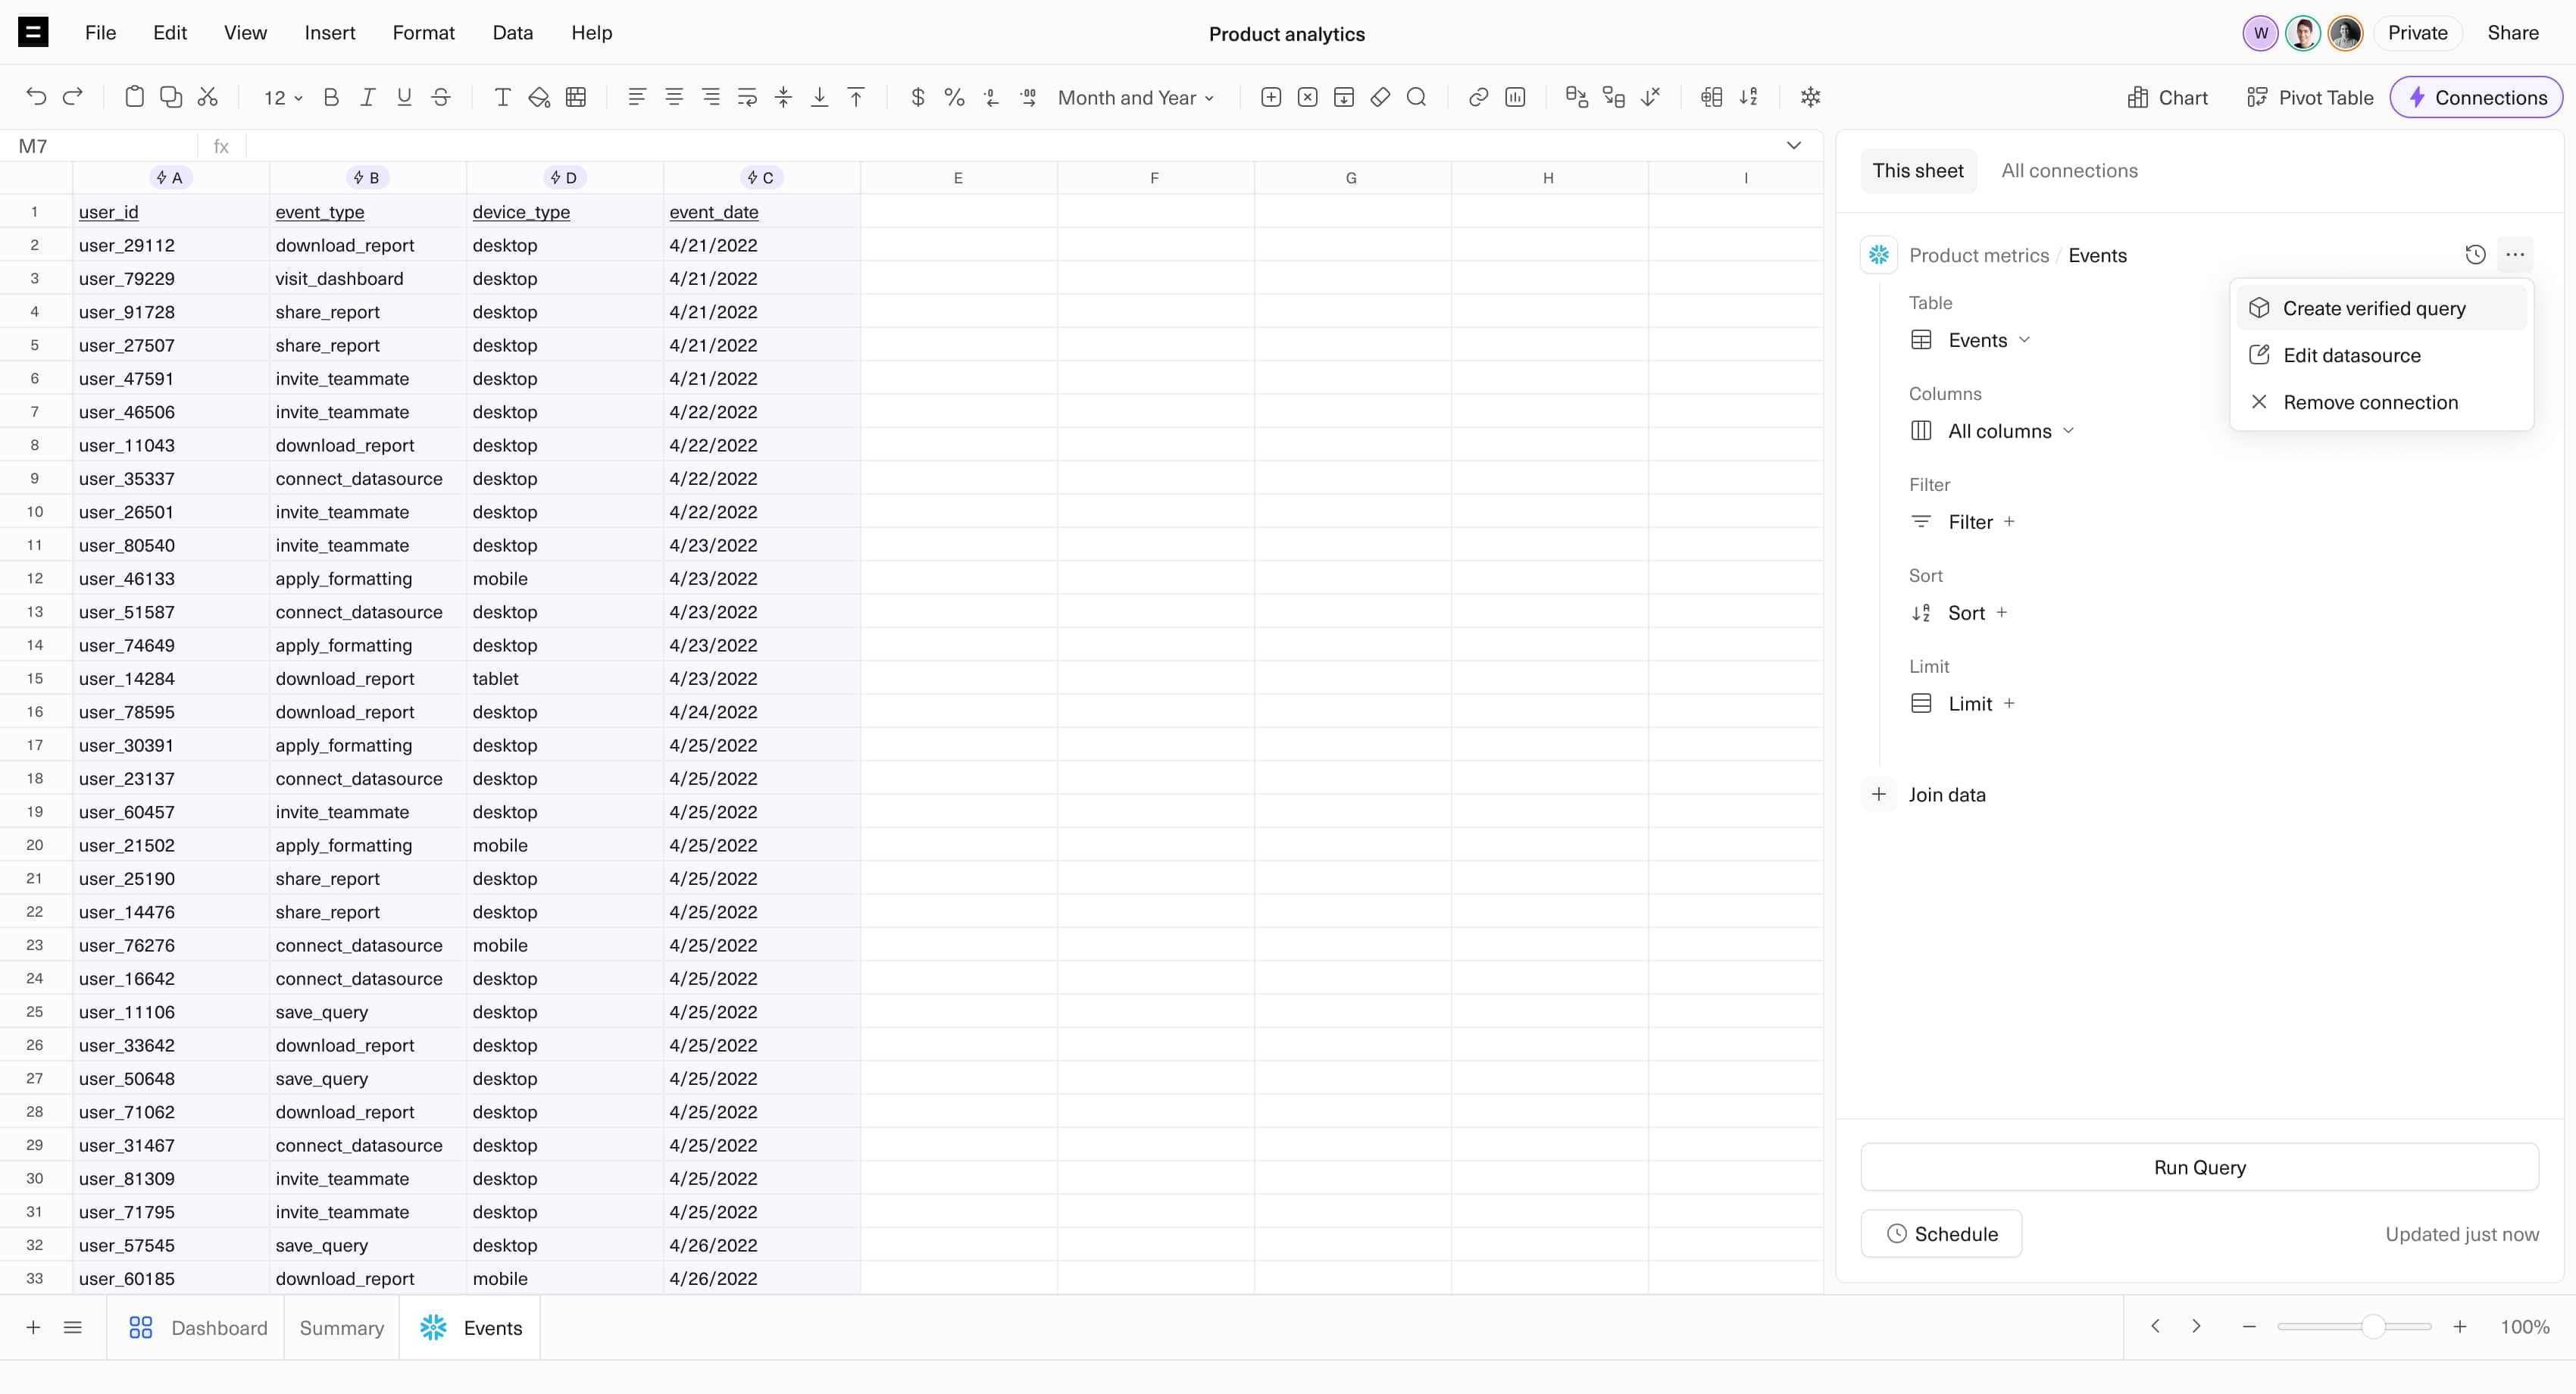
Verified Queries
Build a library of your most important queries and import scripts.
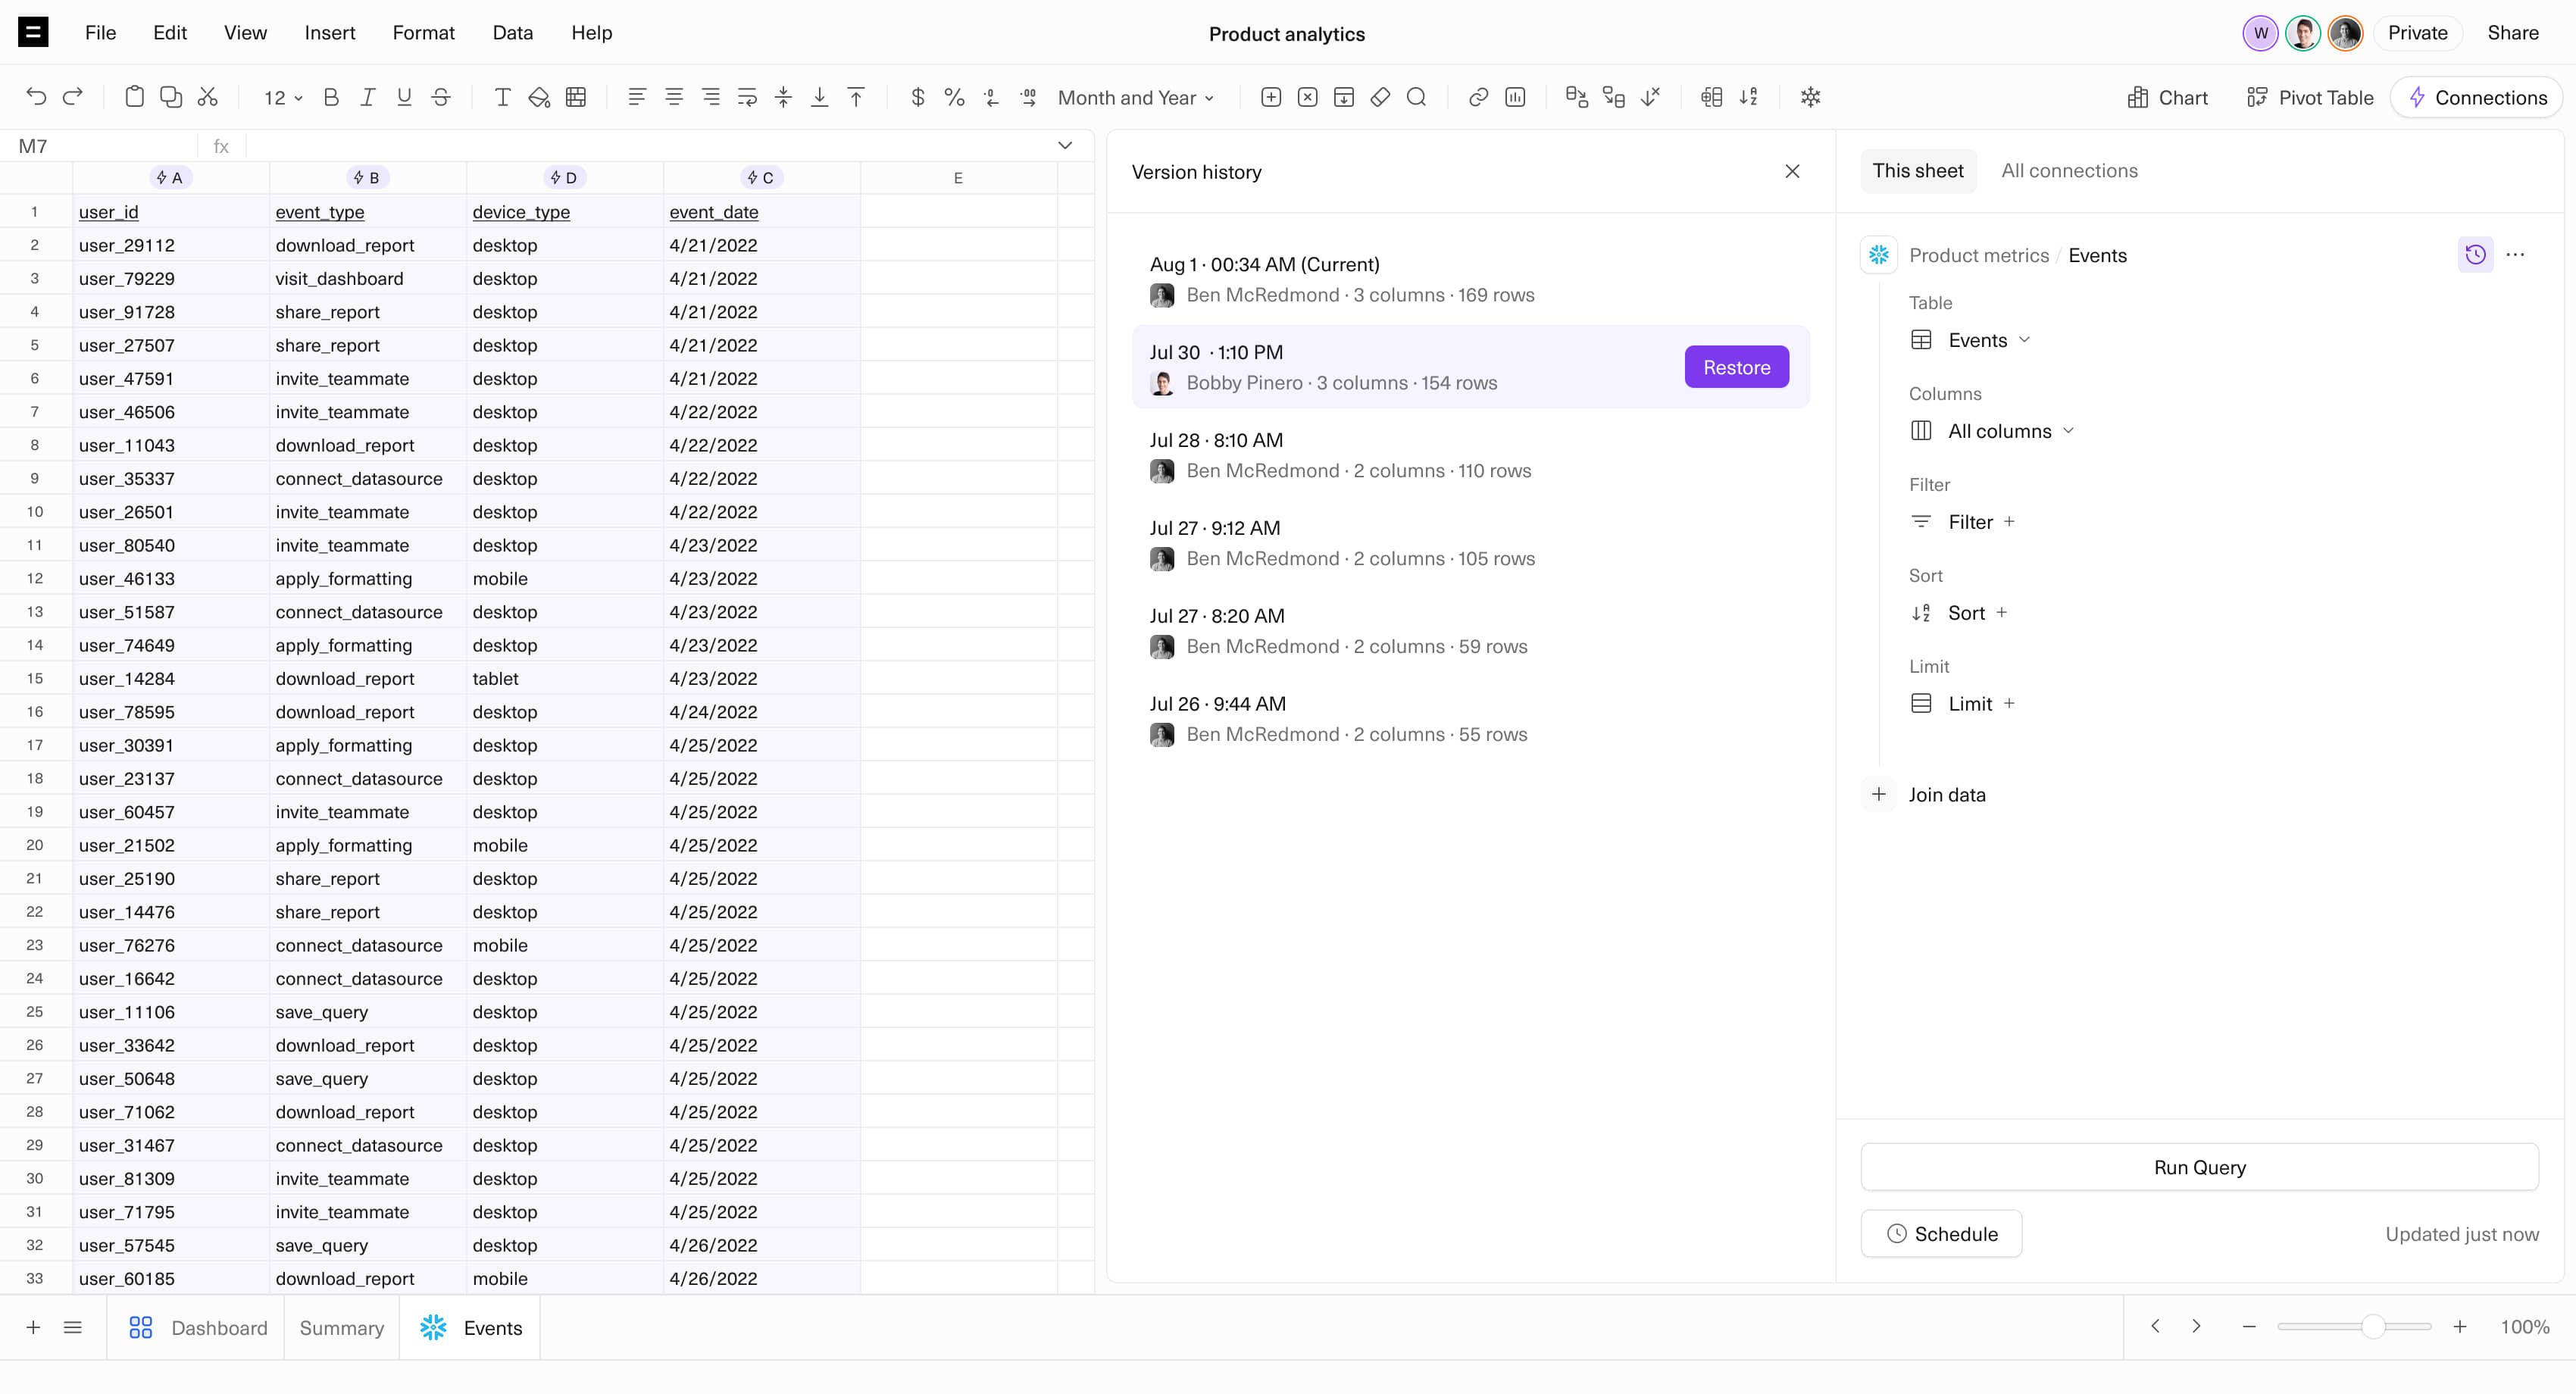
Query Versioning
Ensure your work is always reproducible with versioned queries and query runs.
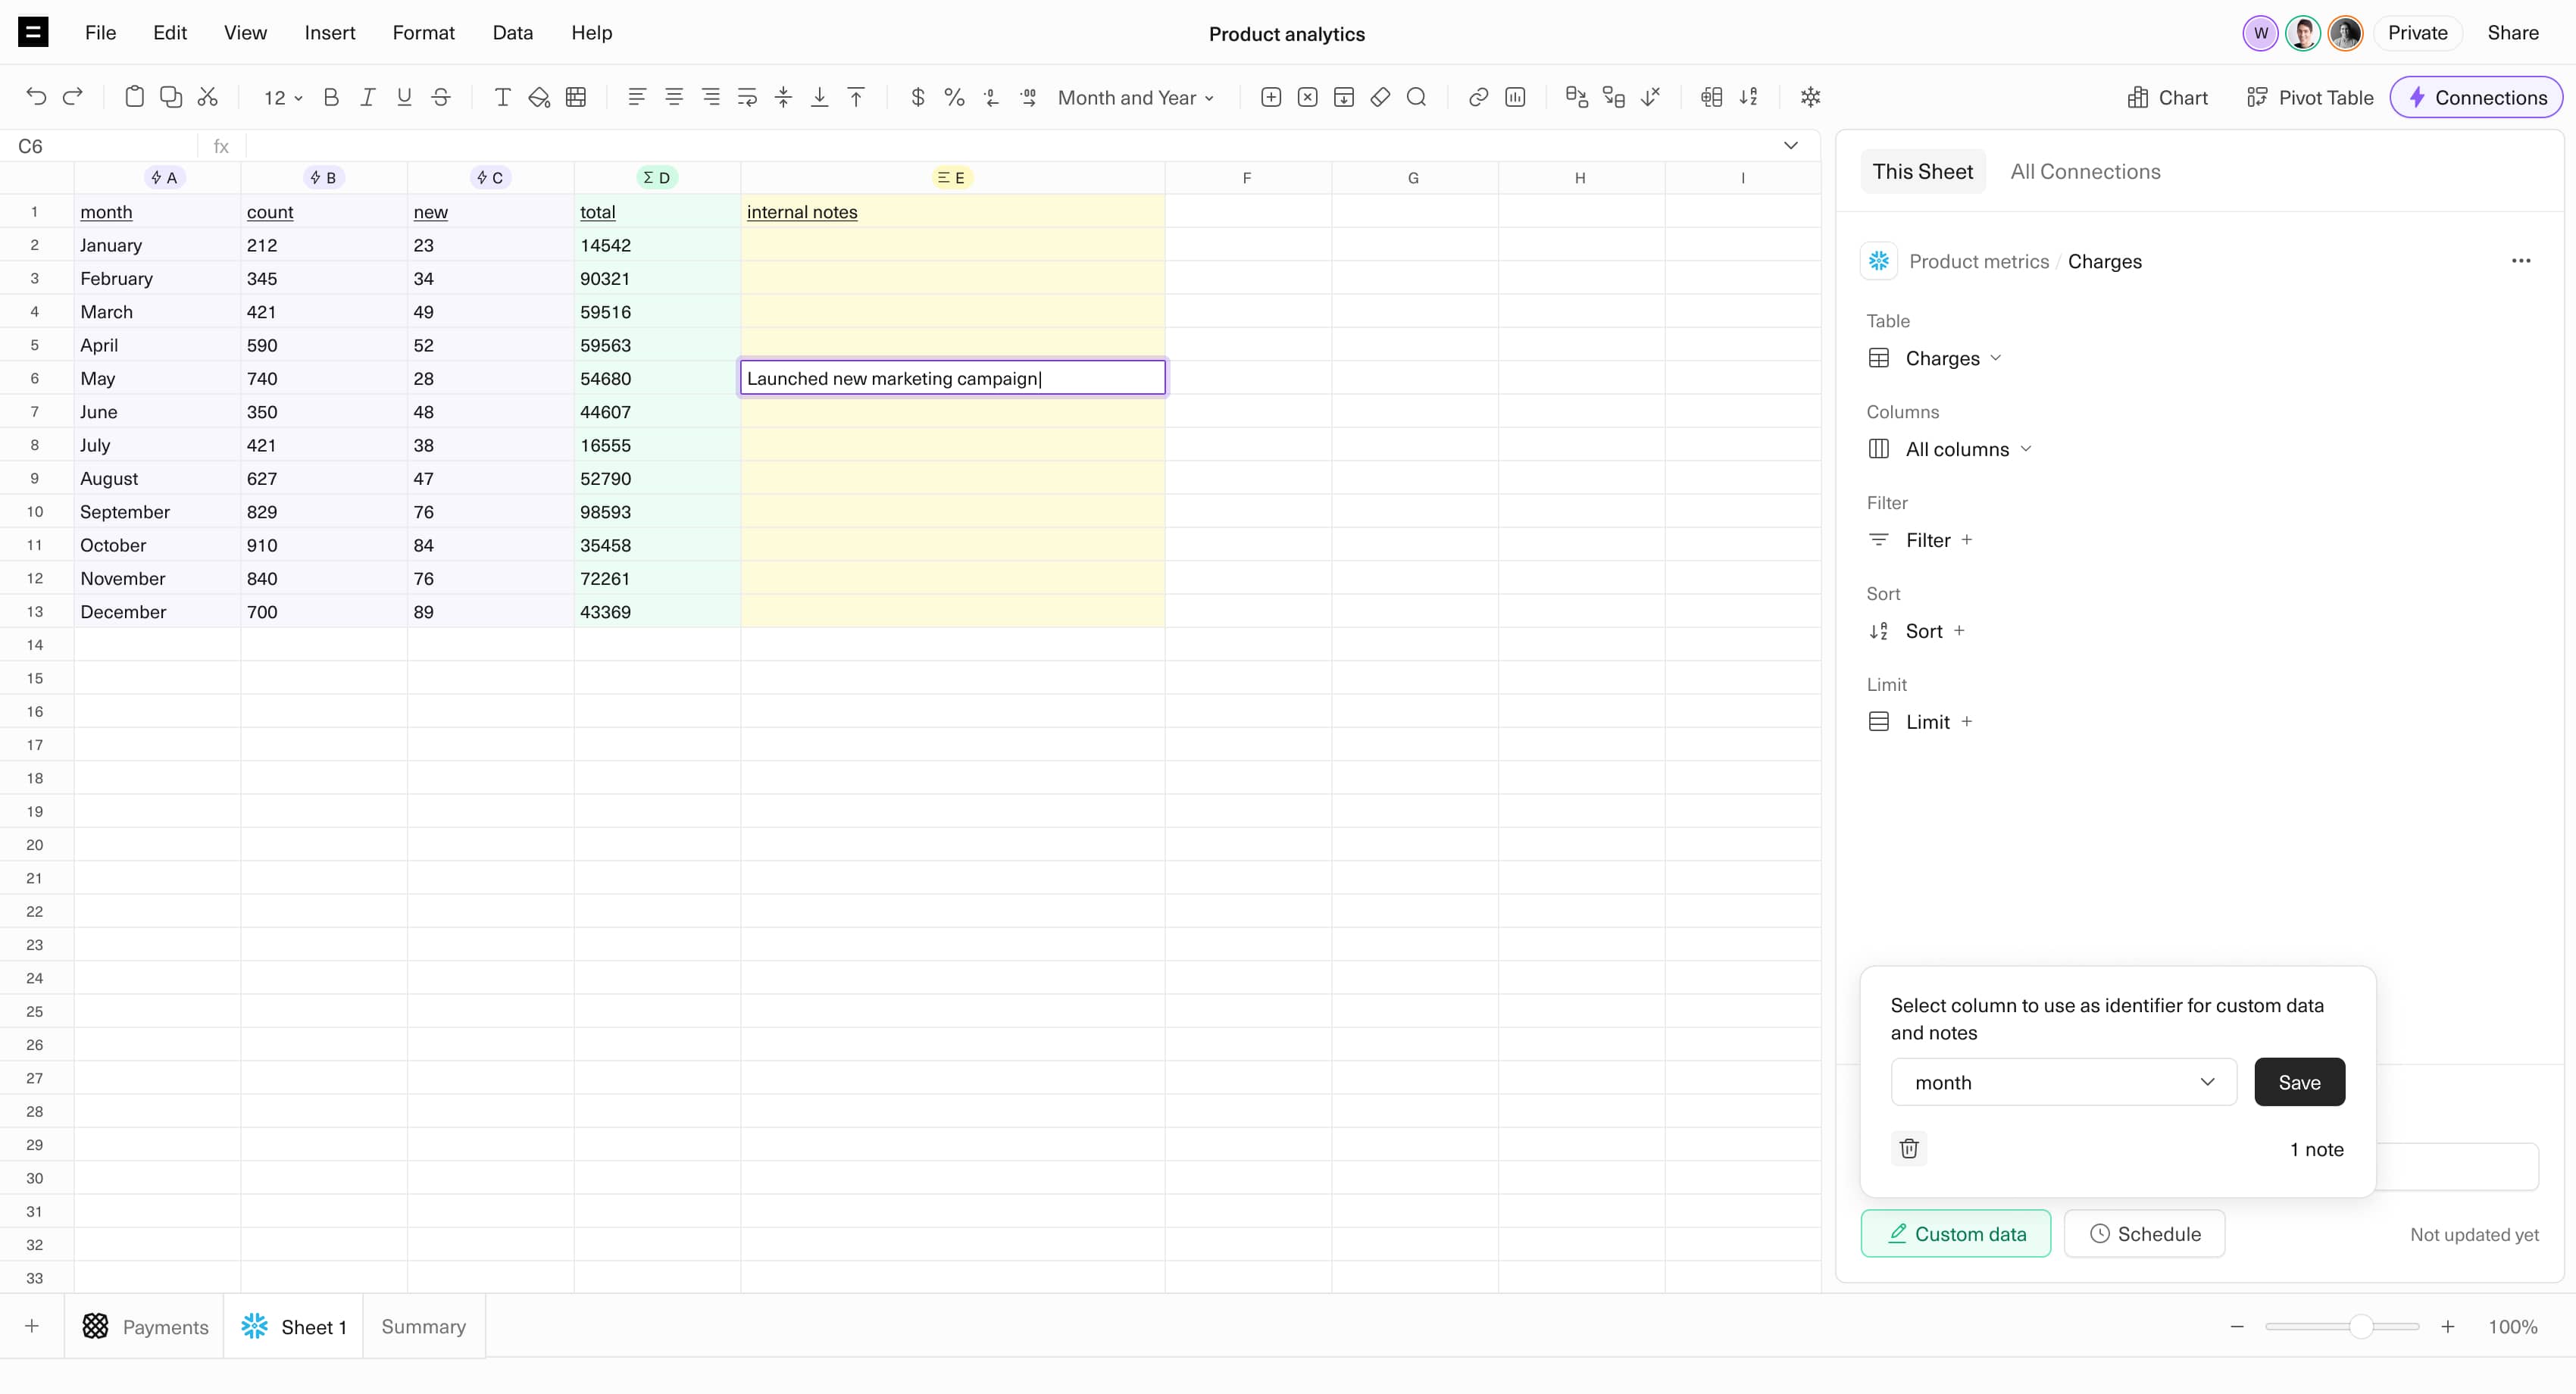
Data Notes
Add notes to queried data that persists in the correct row with every query run.
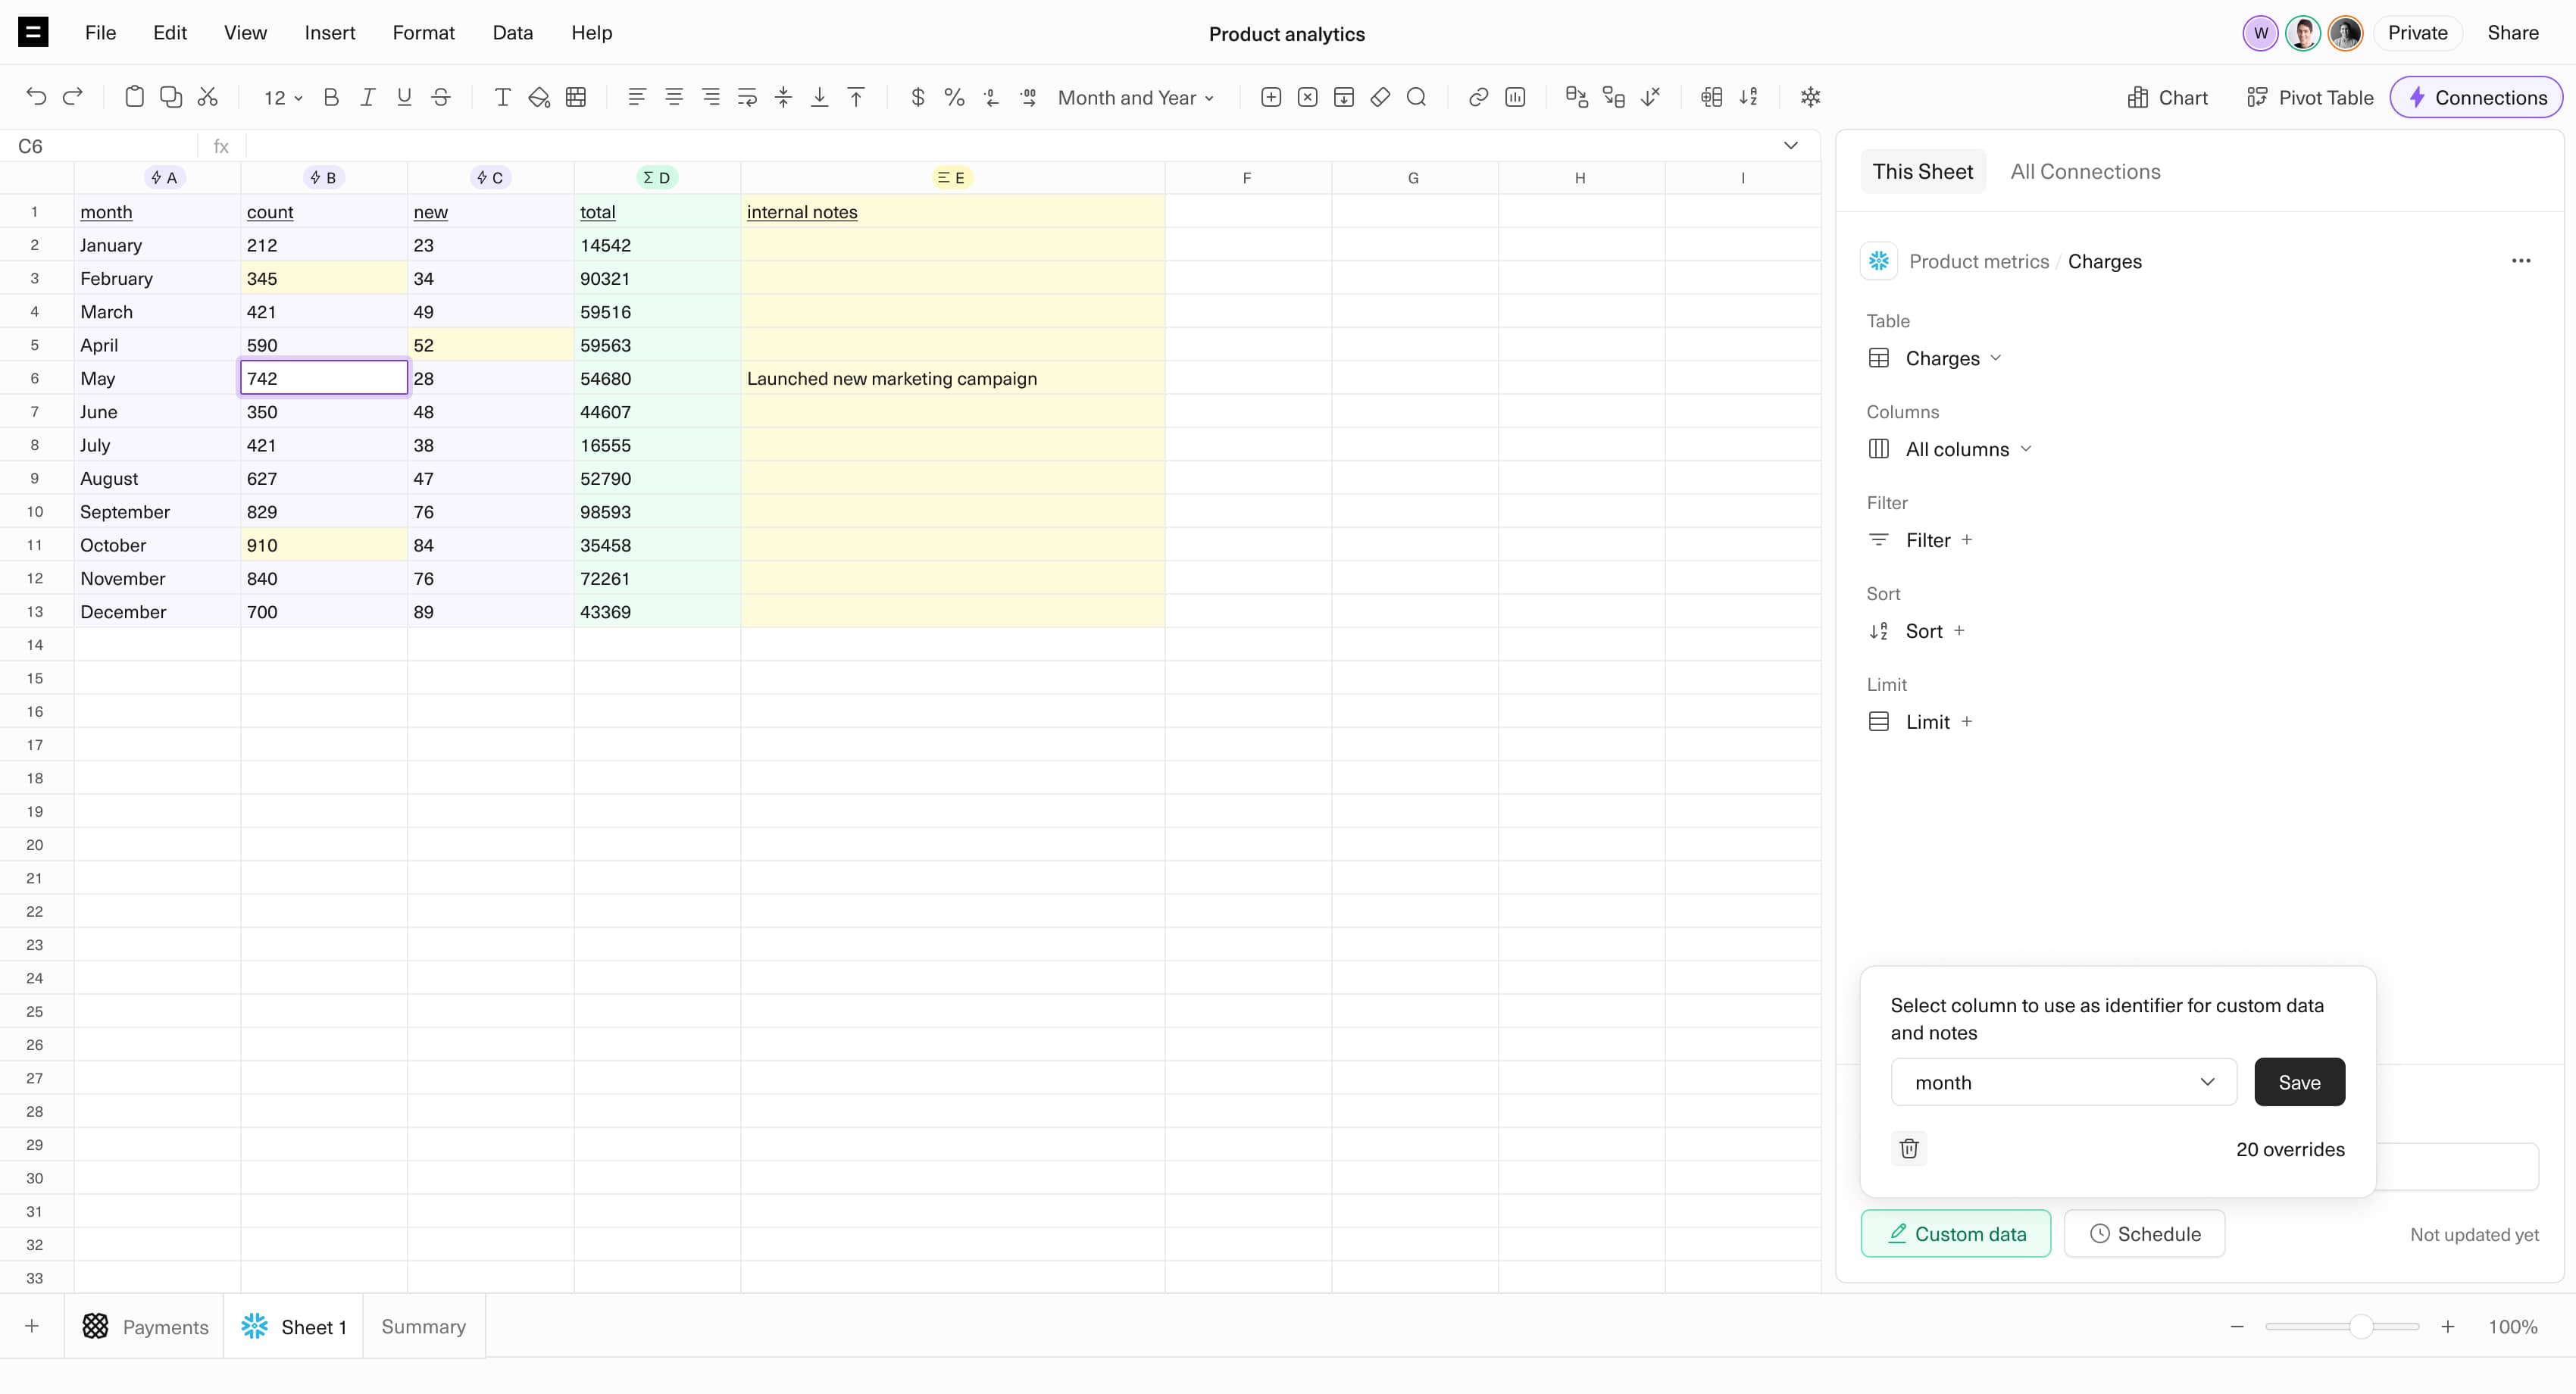
Data Overrides
Make edits to the output of a query that persists the next time the query is run.
Analyze
Transform, calculate, and chart live data with all the fundamentals of a spreadsheet. And some truly magical superpowers.
Learn More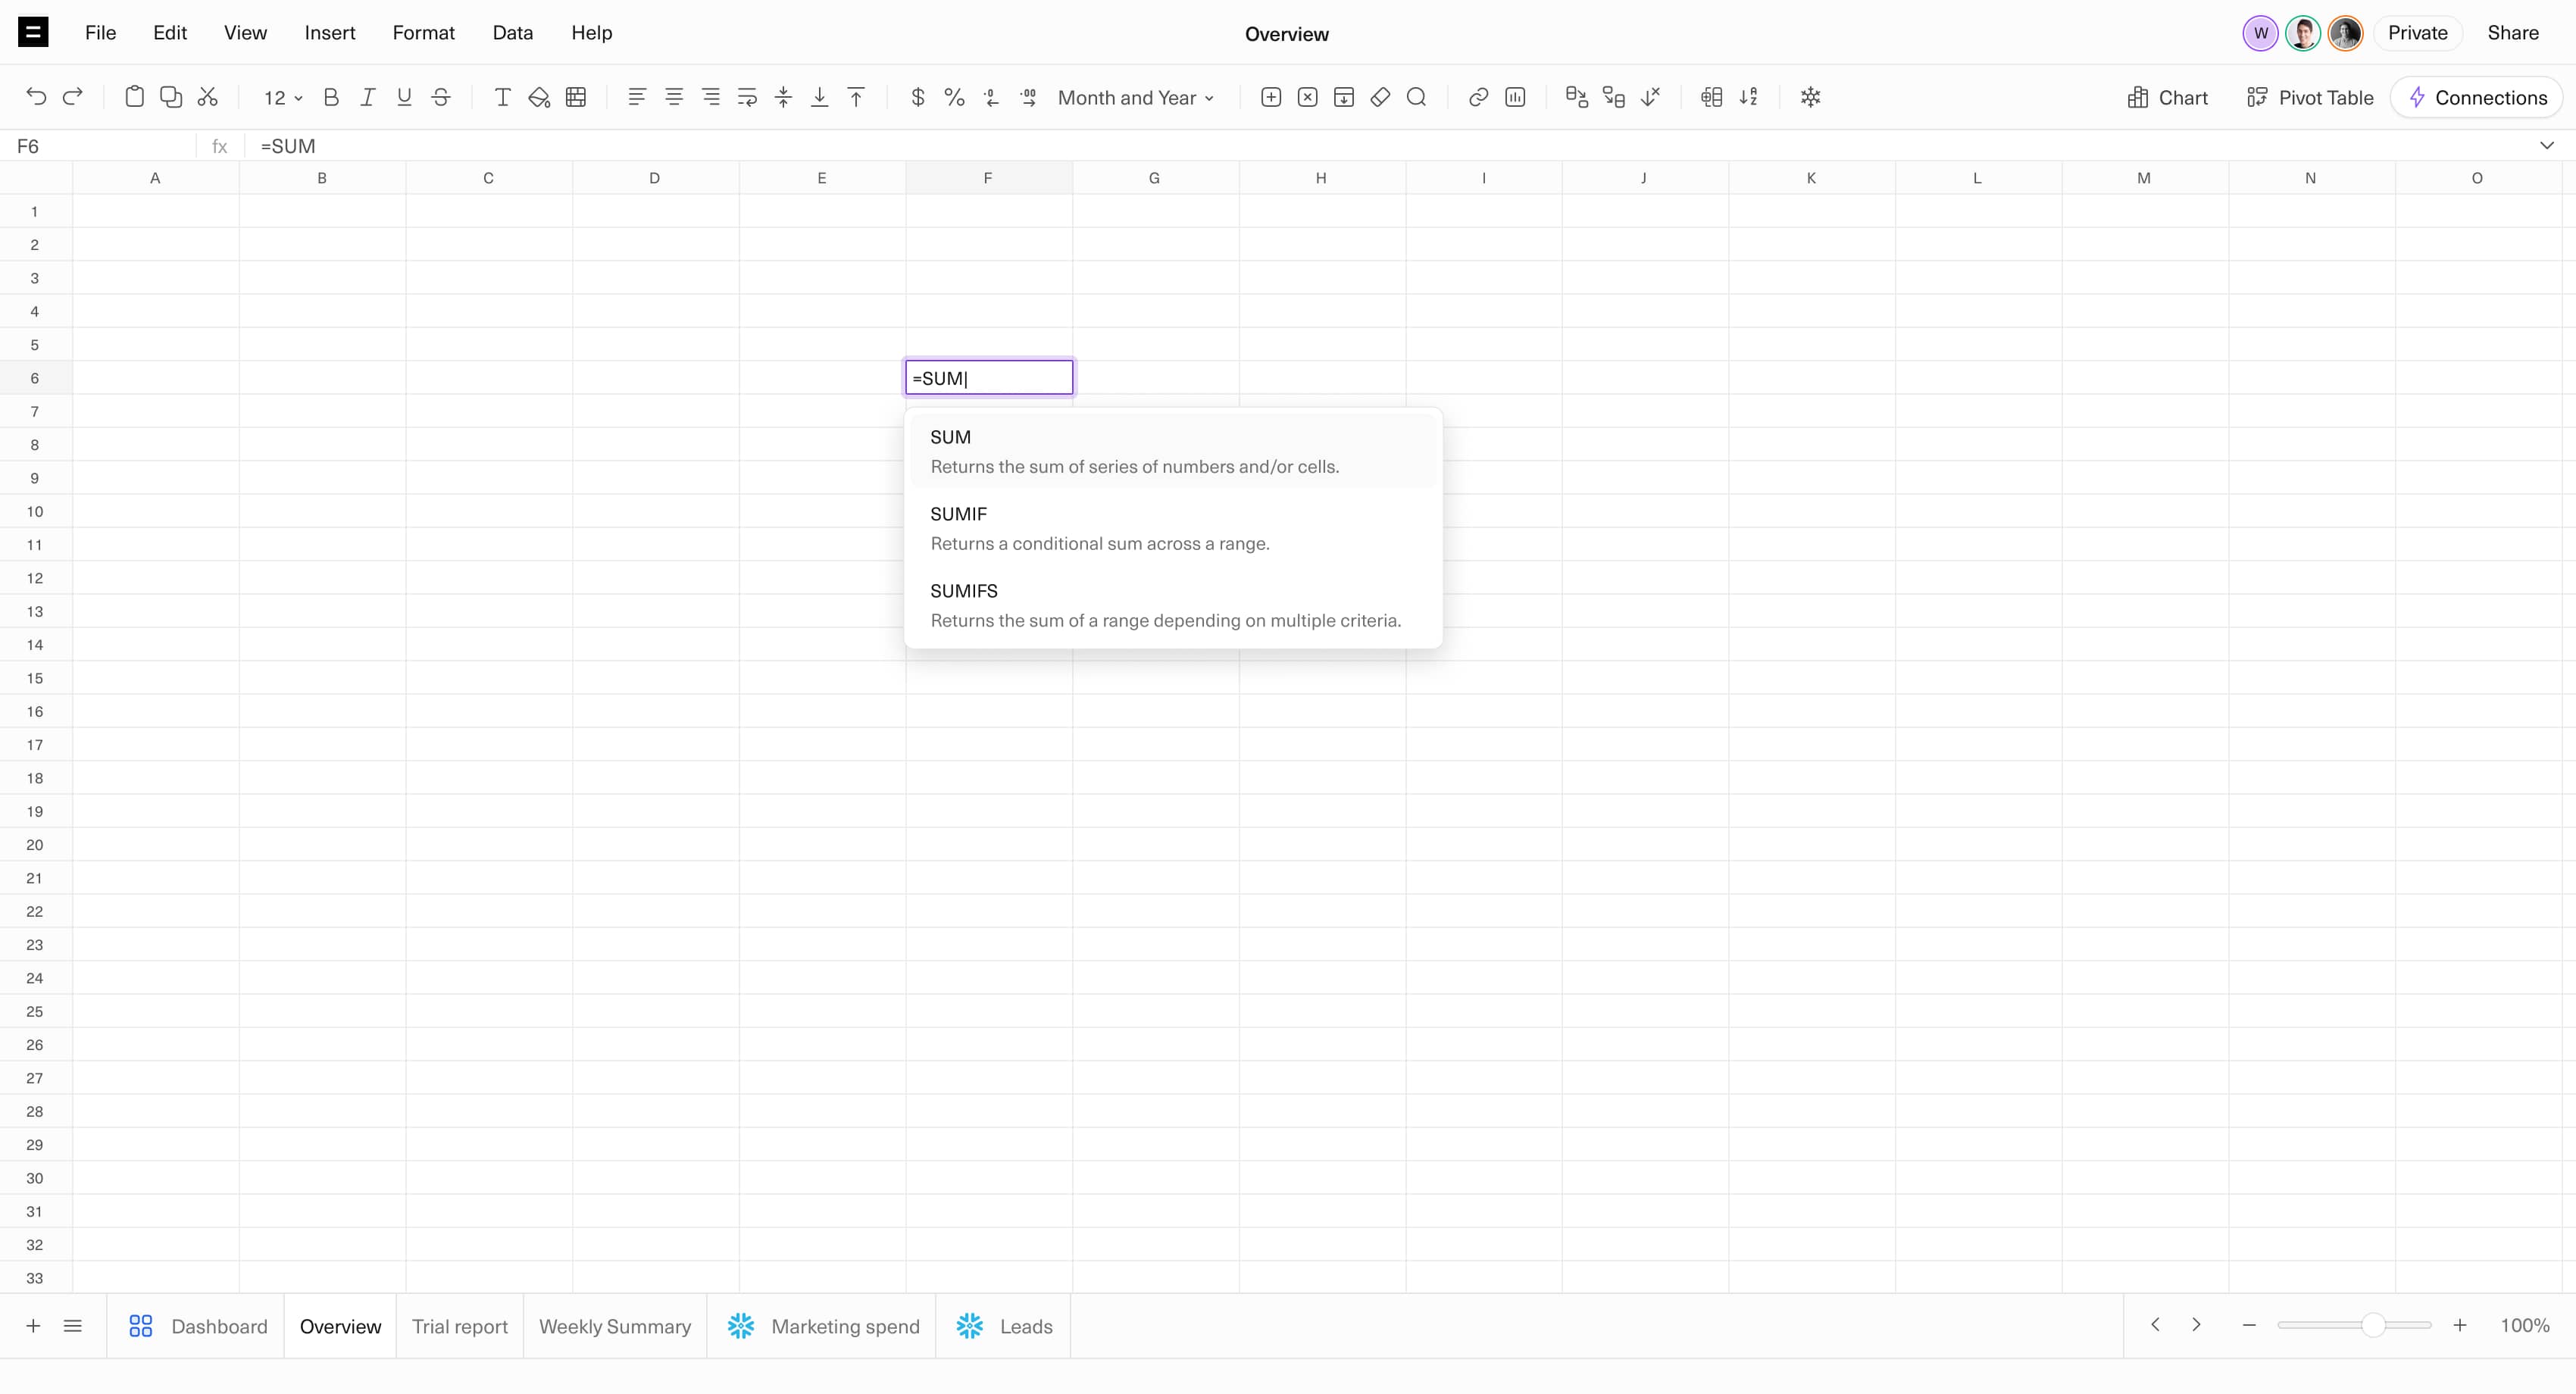
Excel-based Formulas
Use familiar Excel formulas to aggregate and transform data.
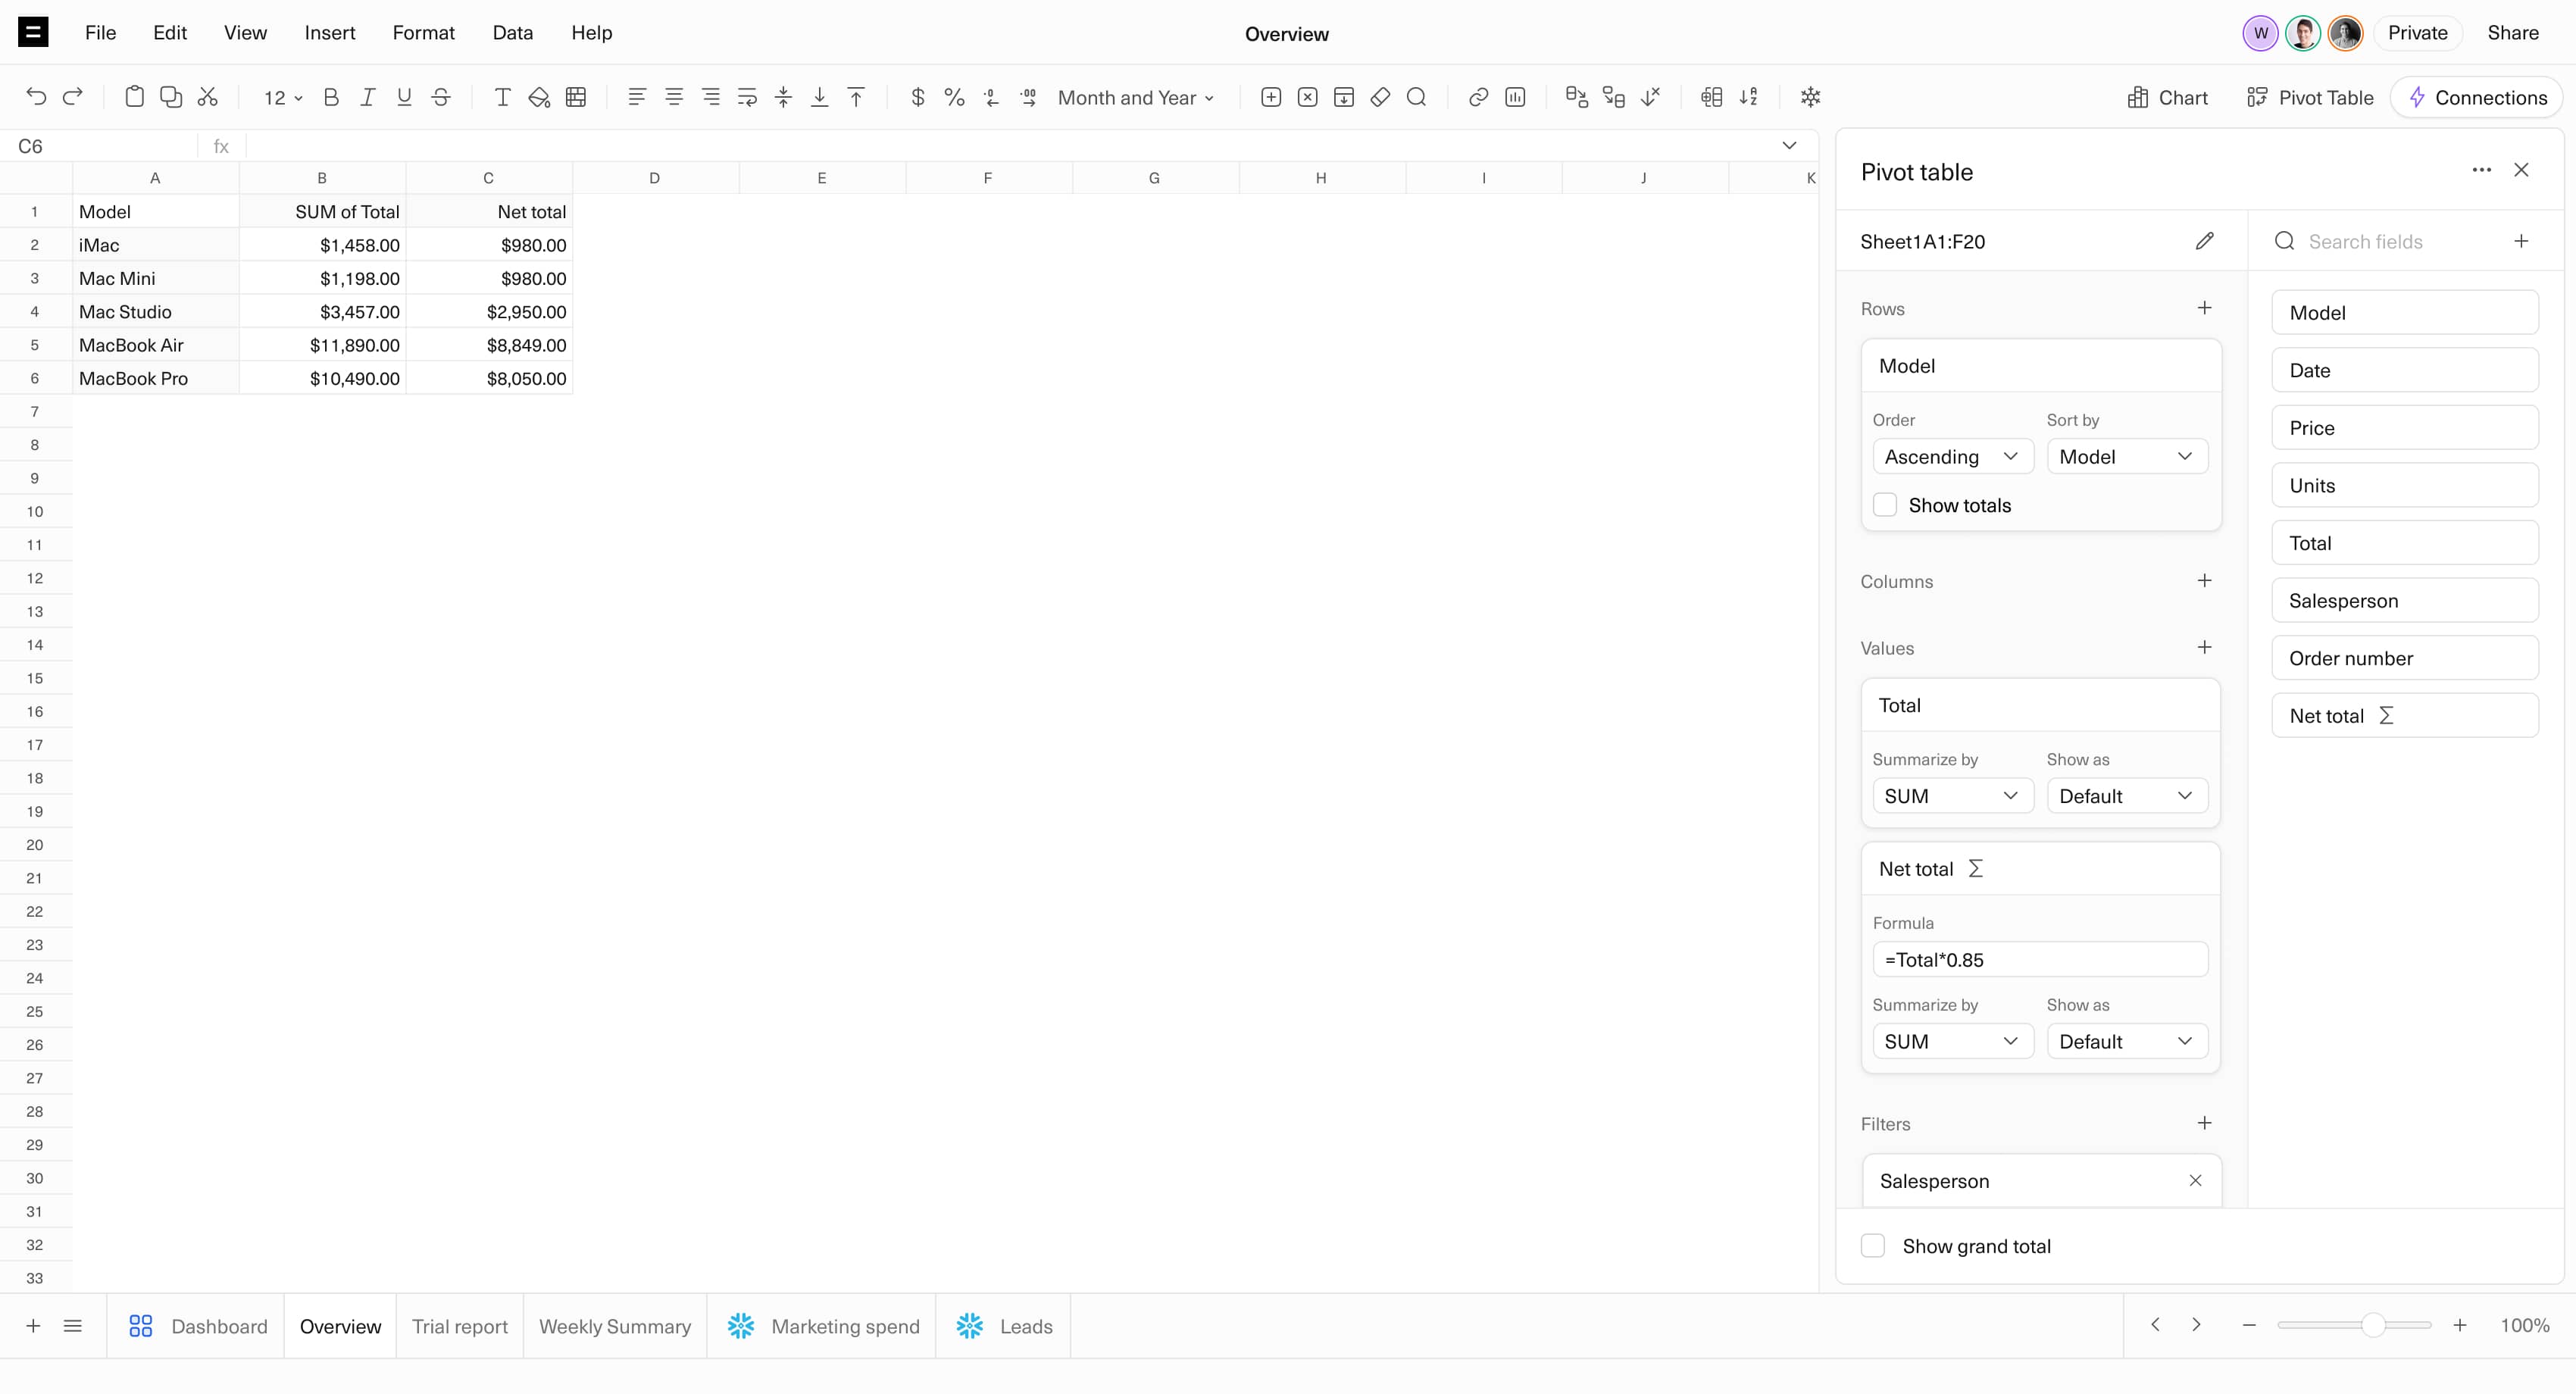
Pivot Tables
Dynamically summarize data without using formulas.
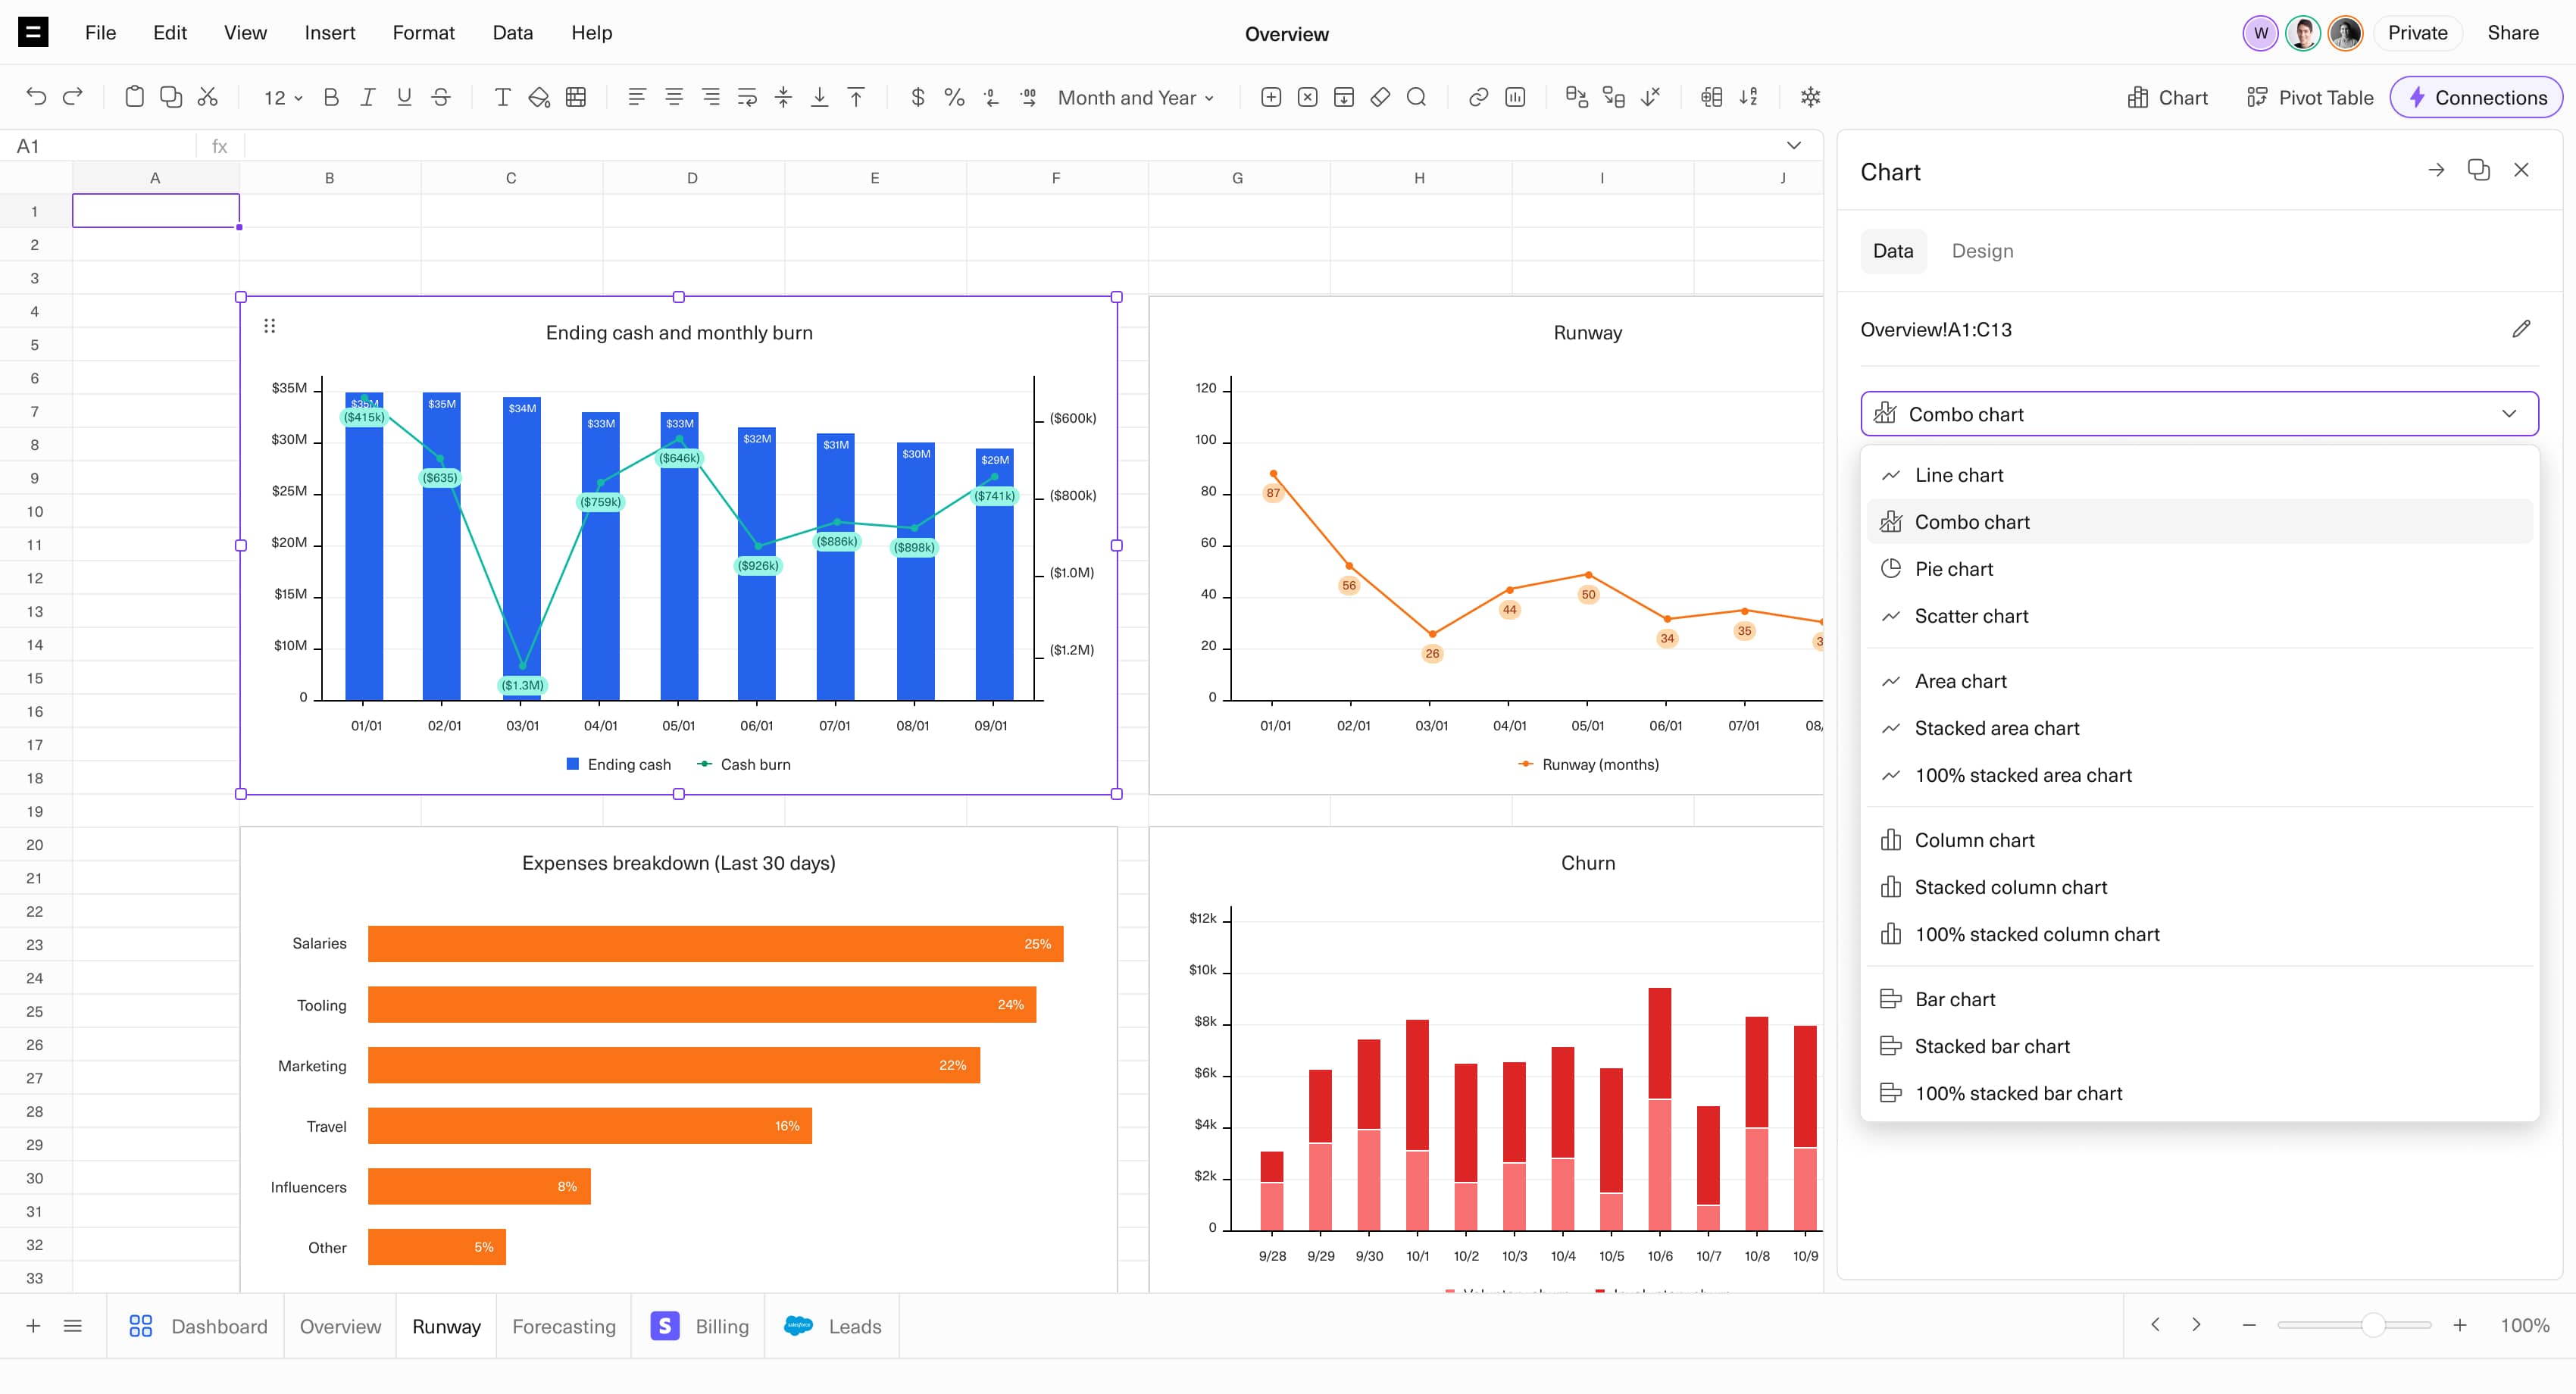
Charts
Visualize data using 10+ chart types, including Line, Area, Scatter, Column, Bar, and Pie charts.
Excel-based Shortcuts
Access common keyboard shortcuts, including the full set of Excel’s alt mode shortcuts.
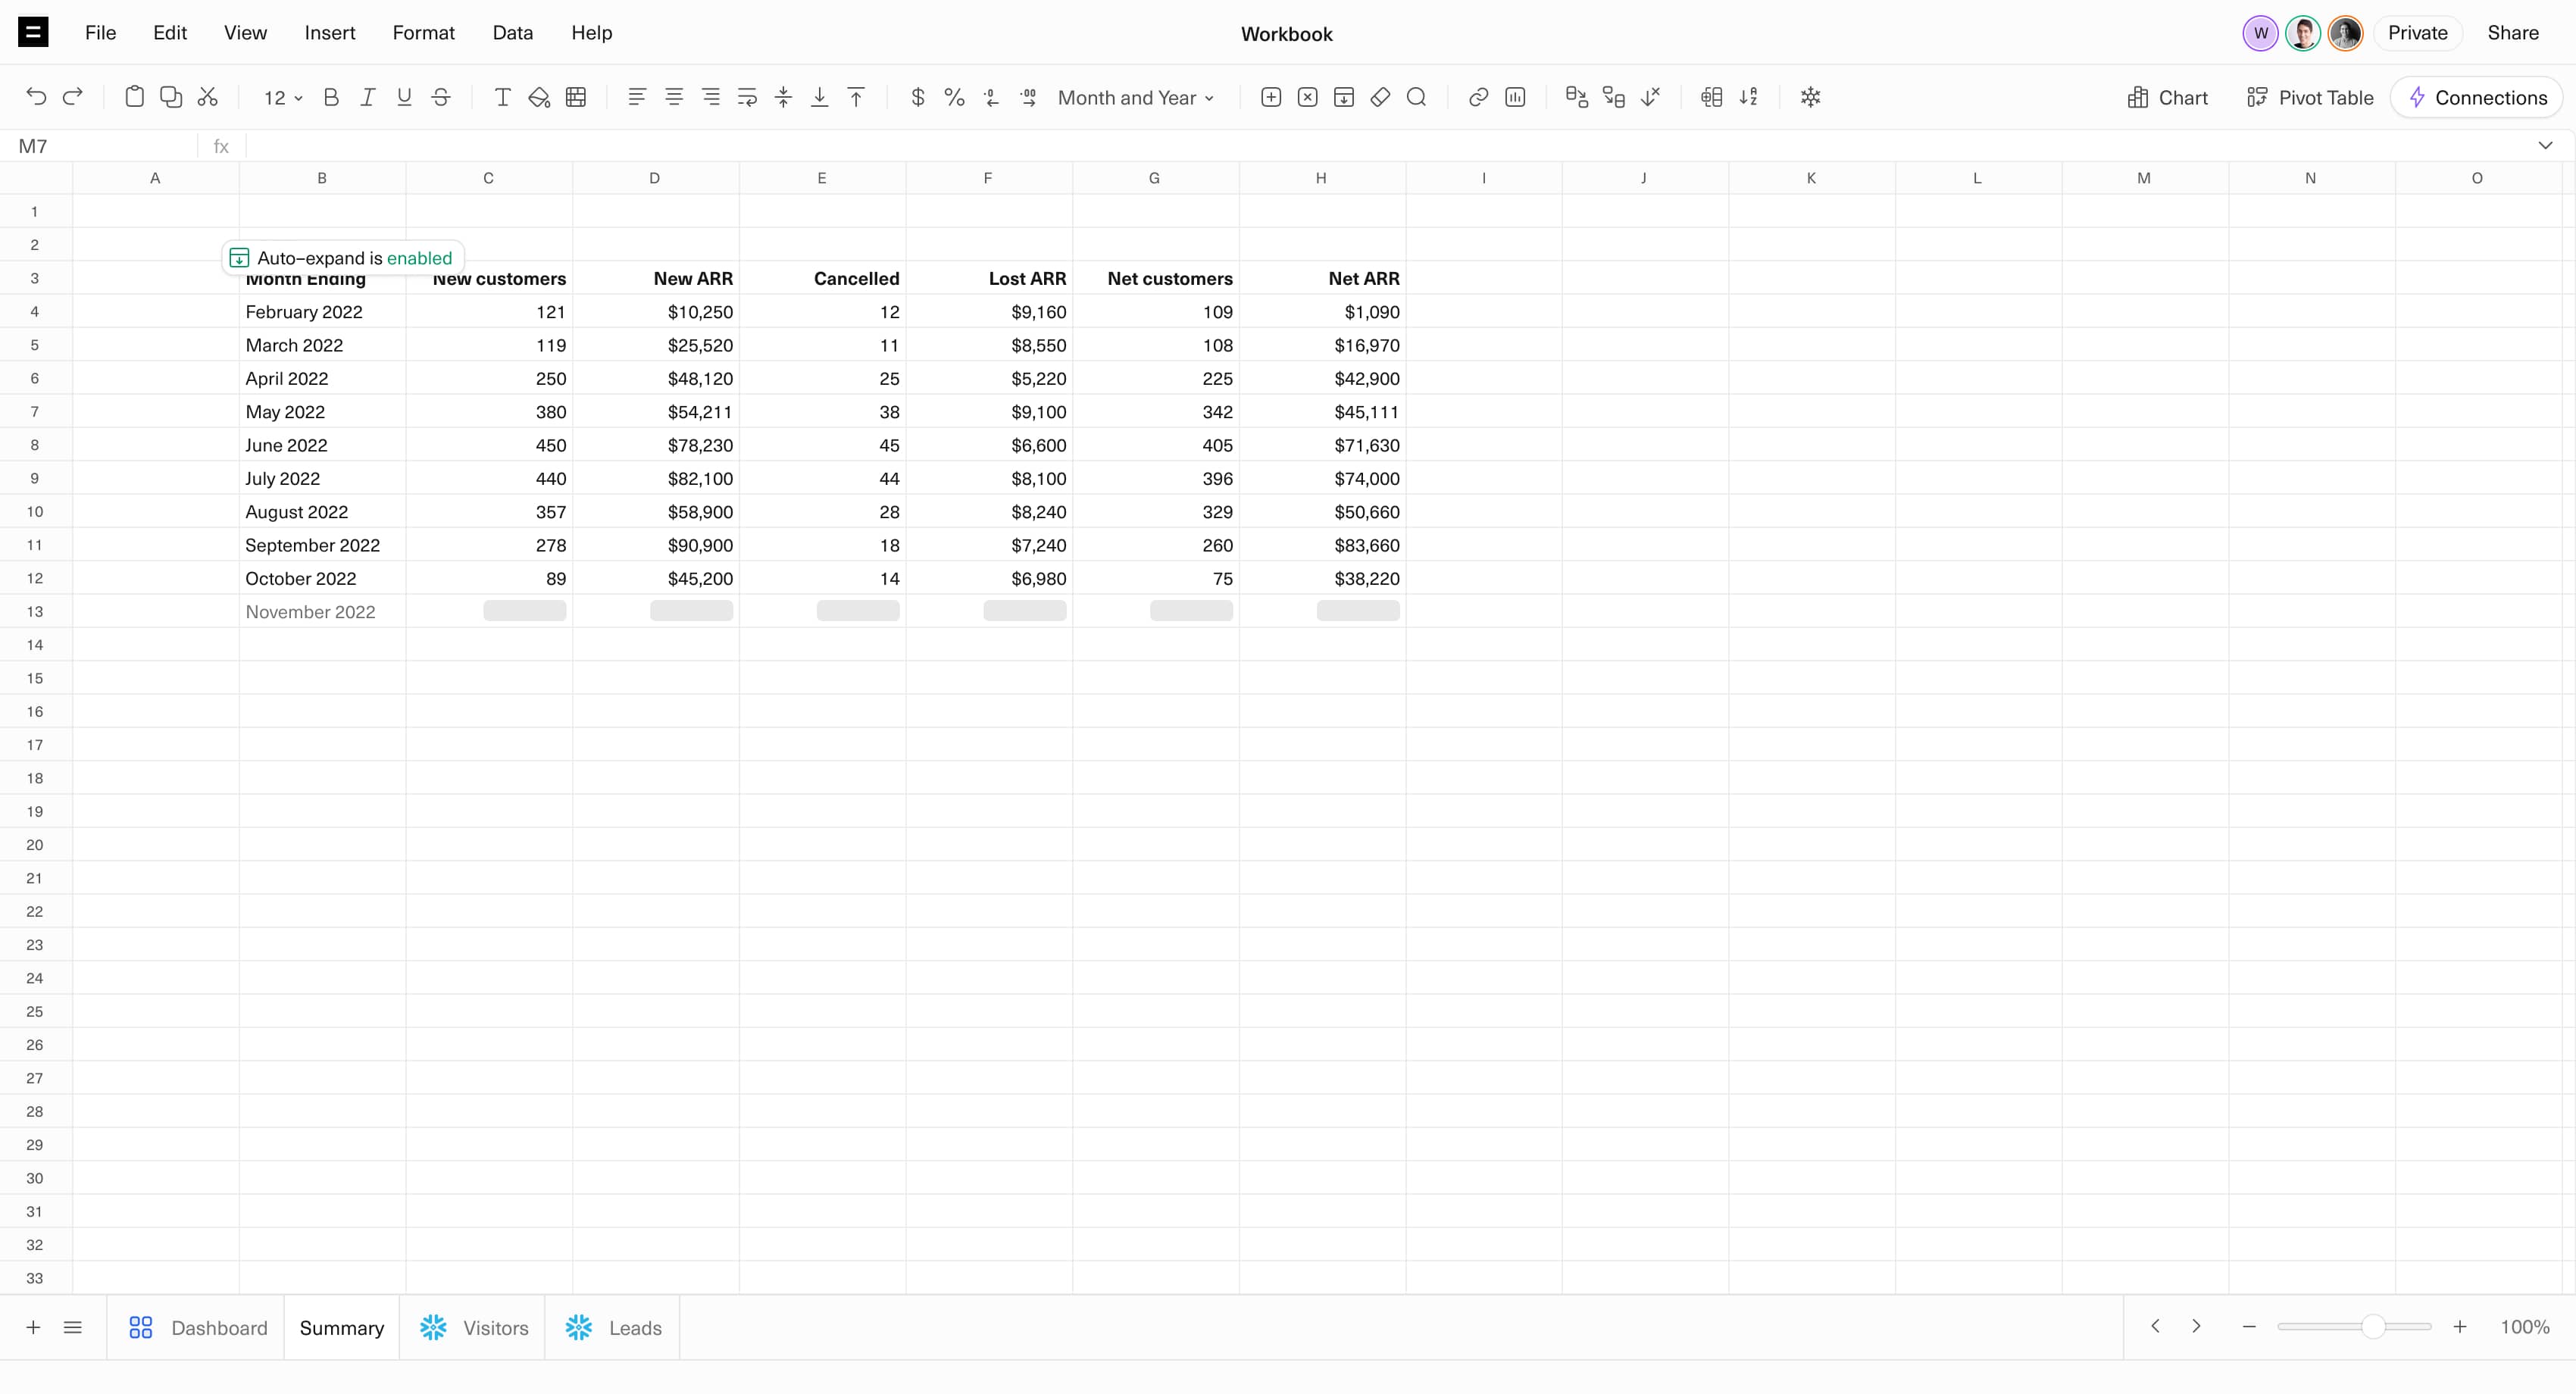
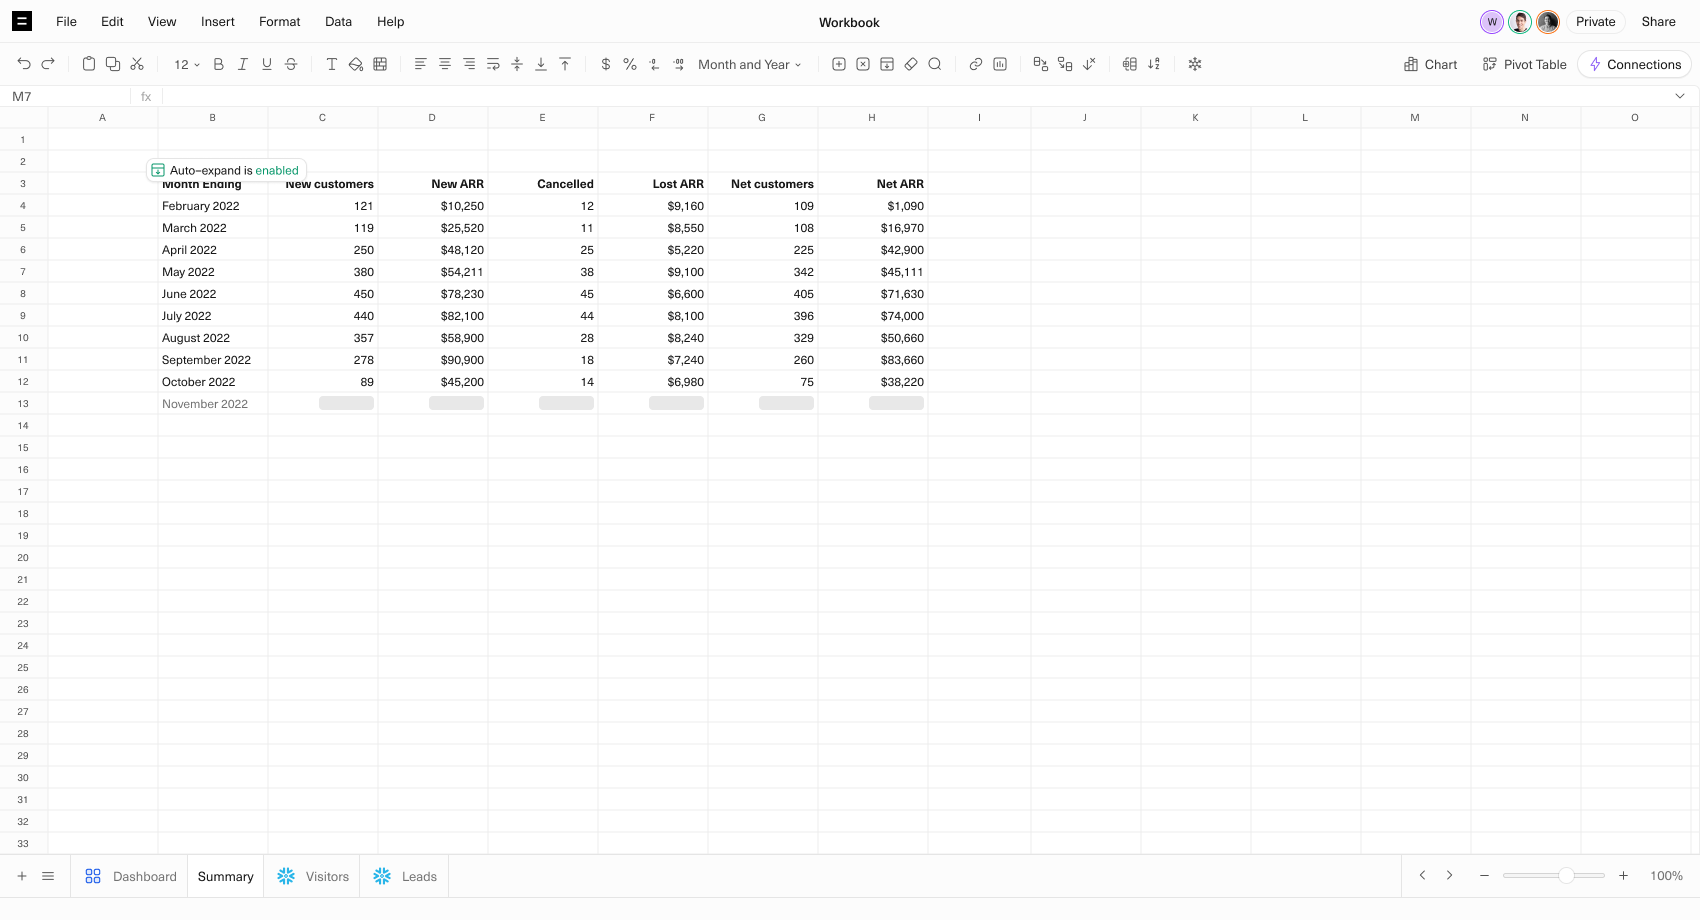
Auto-expand
Set tables and charts to dynamically expand with new data after each query run.
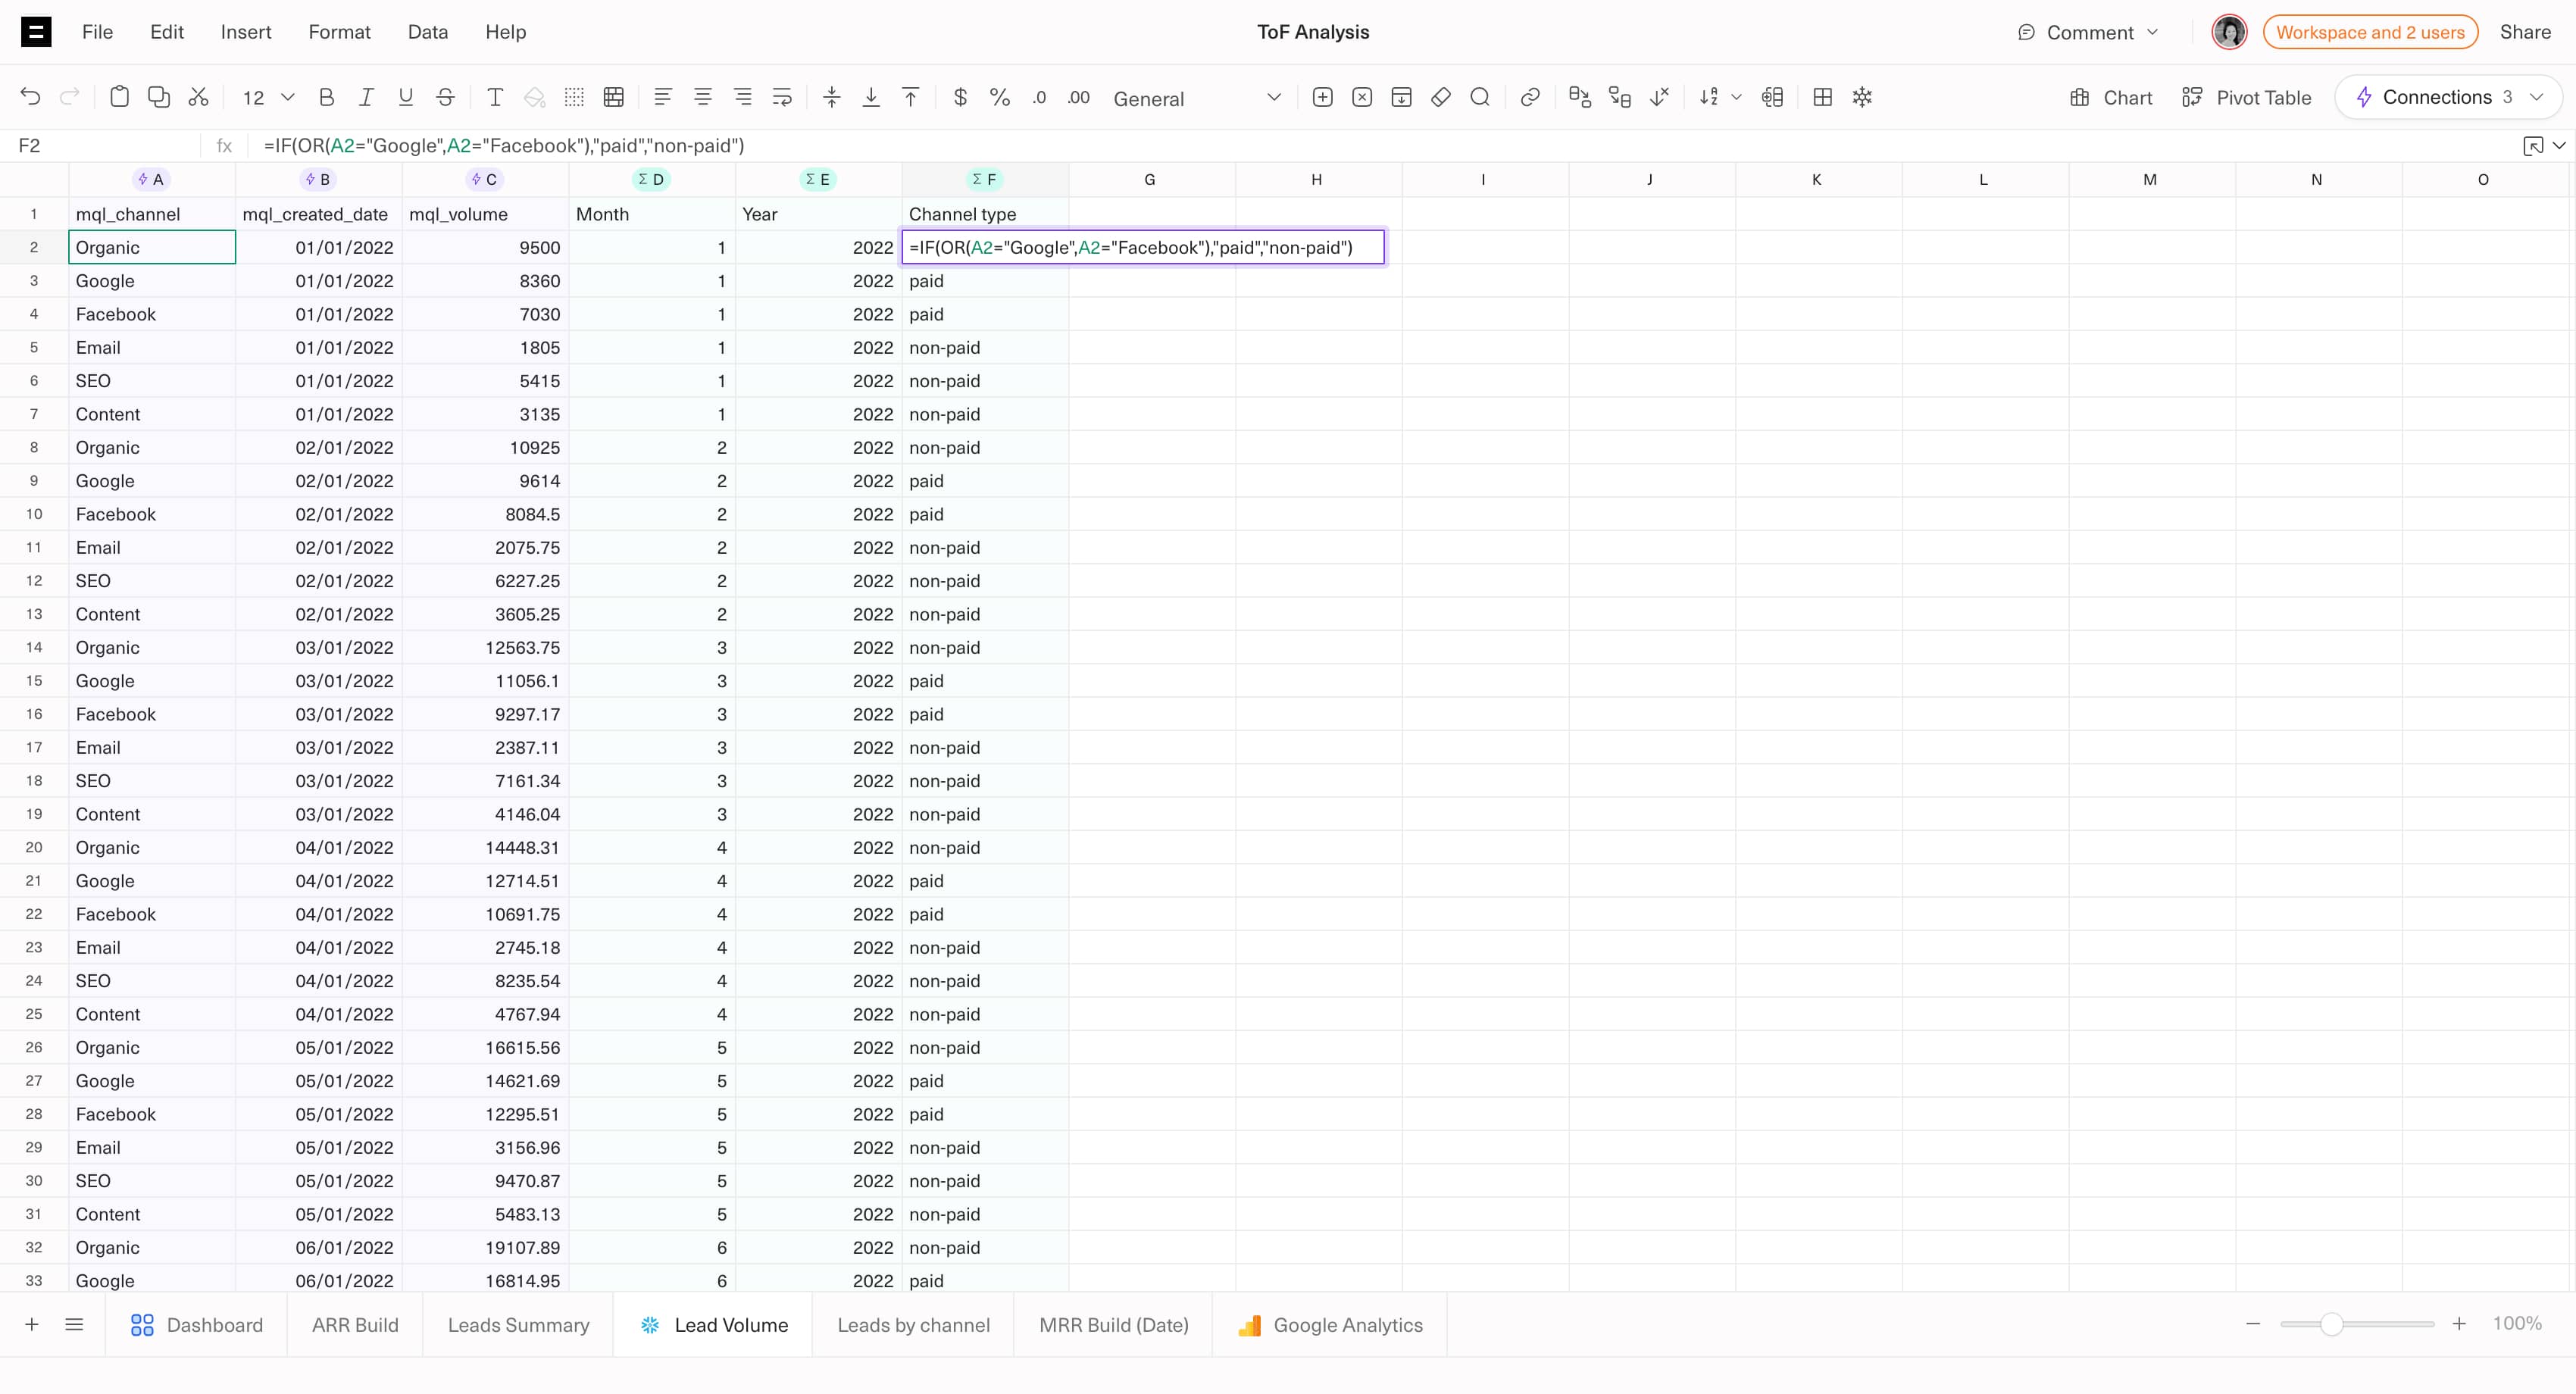
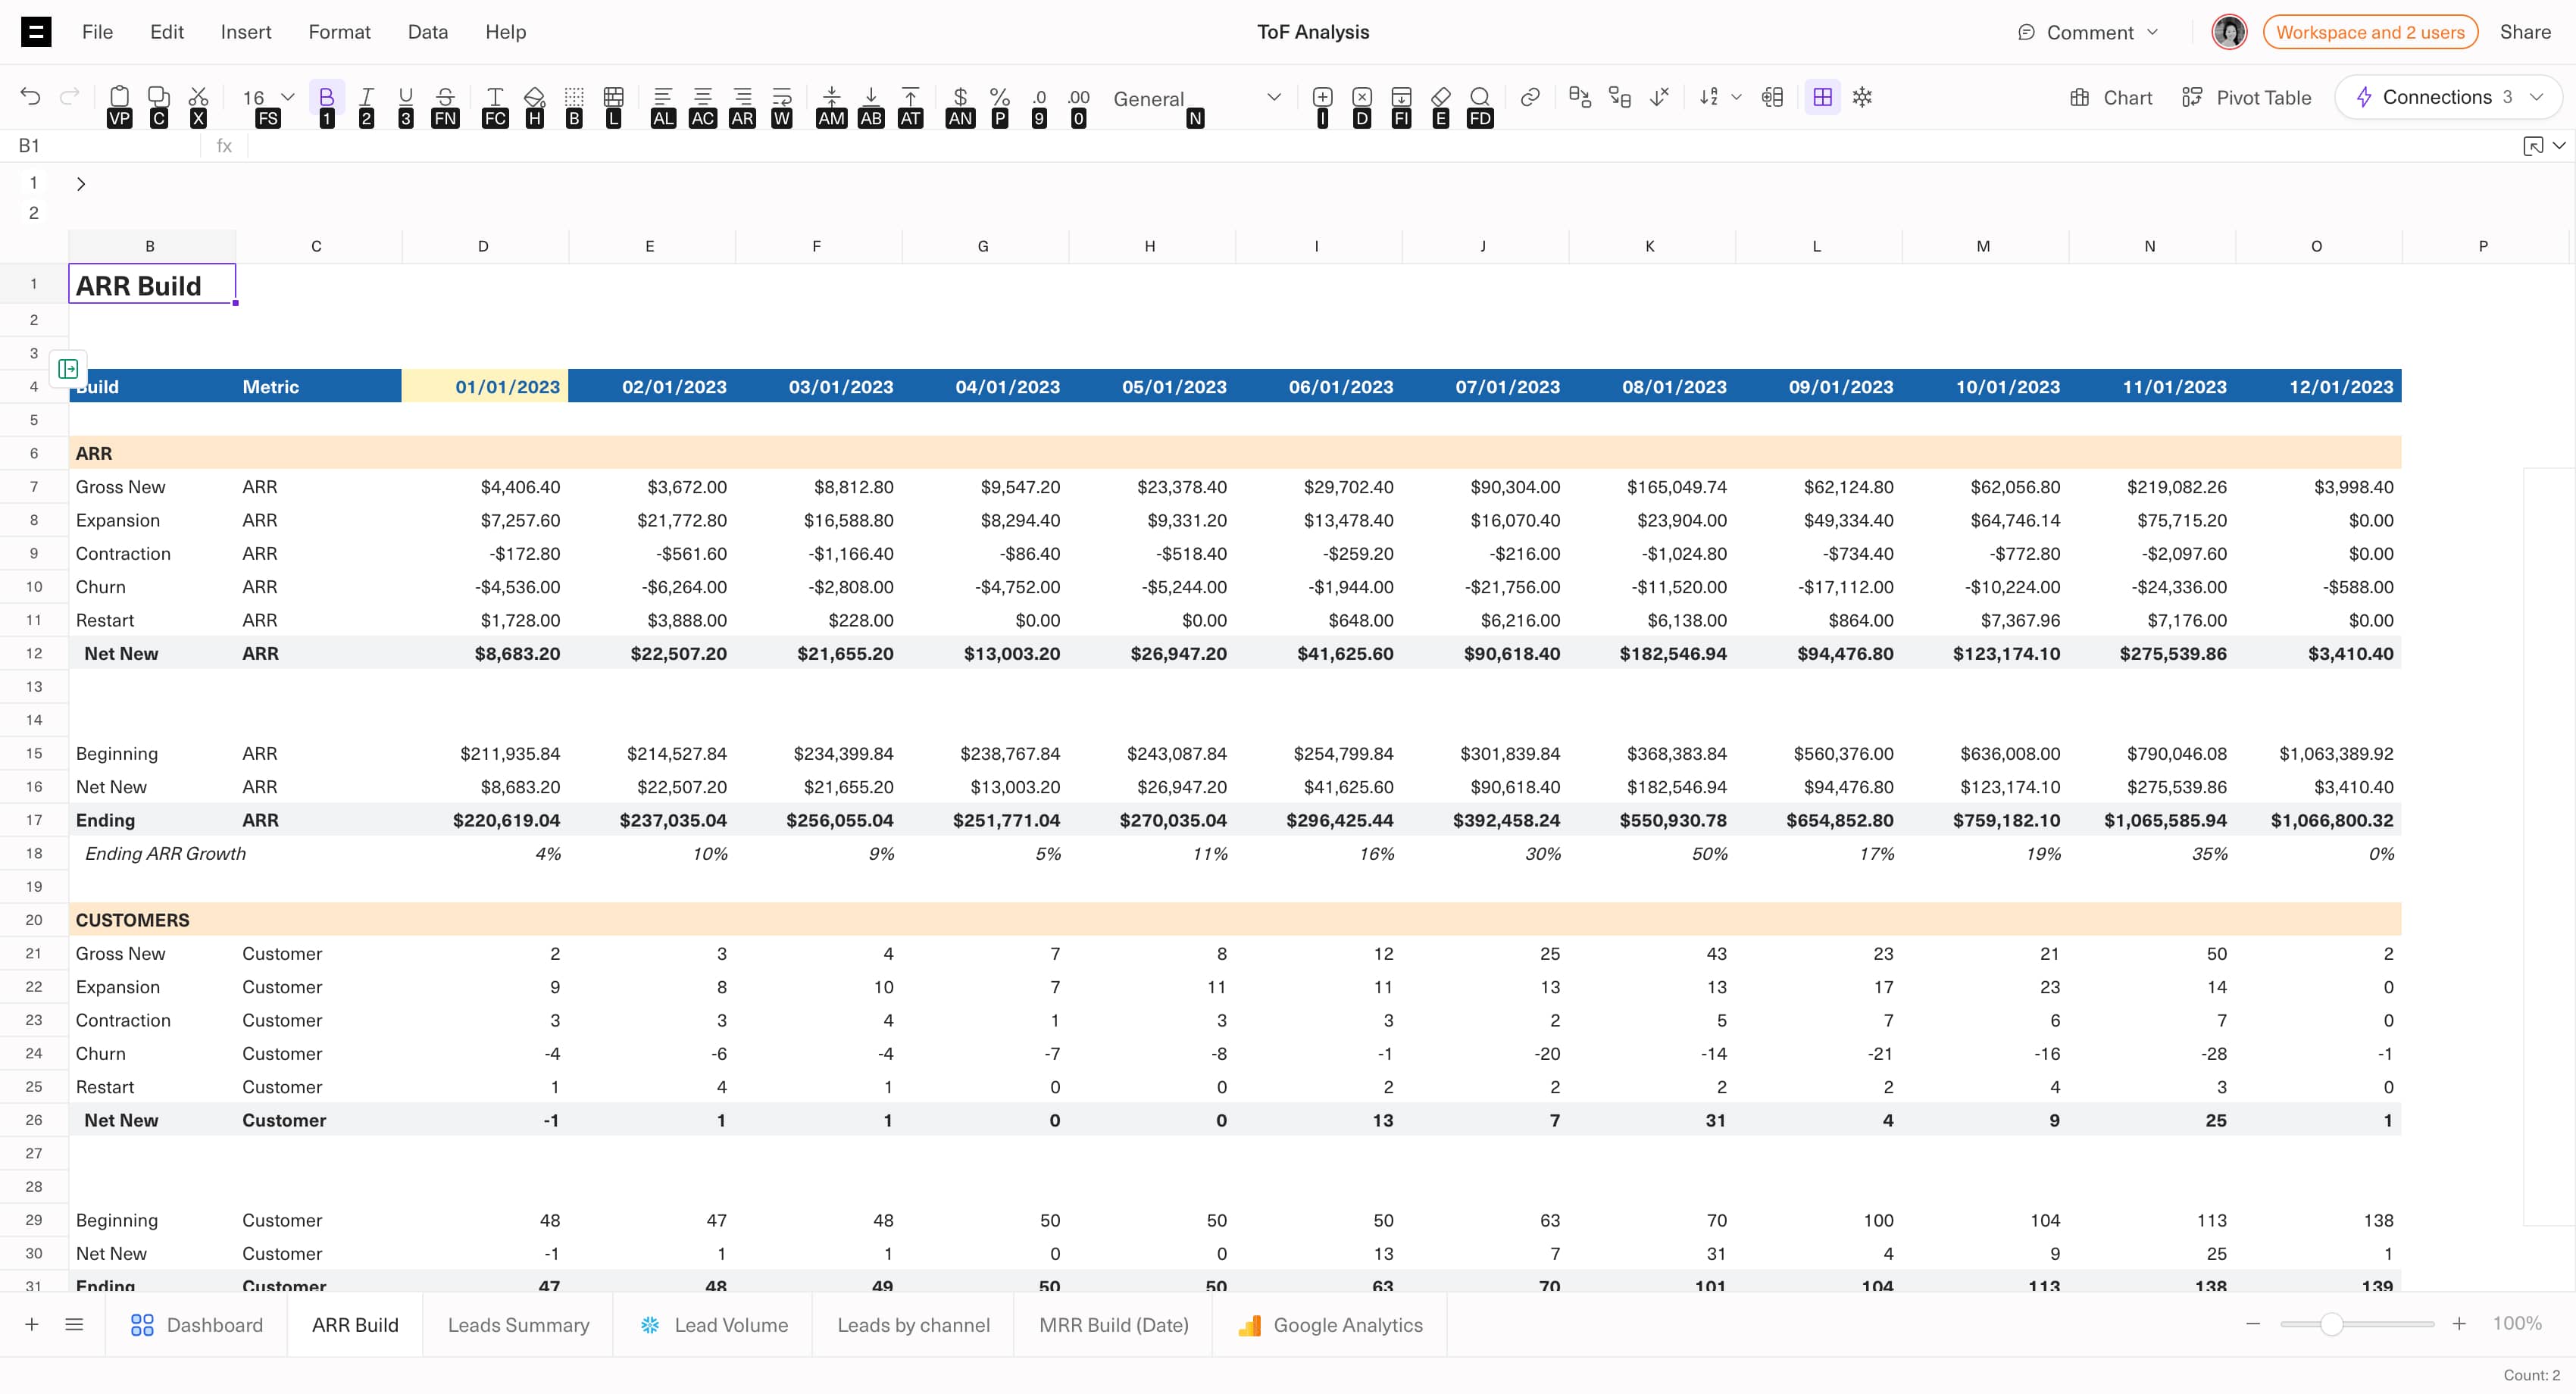
Calculated Columns
Enter a formula next to raw data to create a column that expands and contracts with each query run.
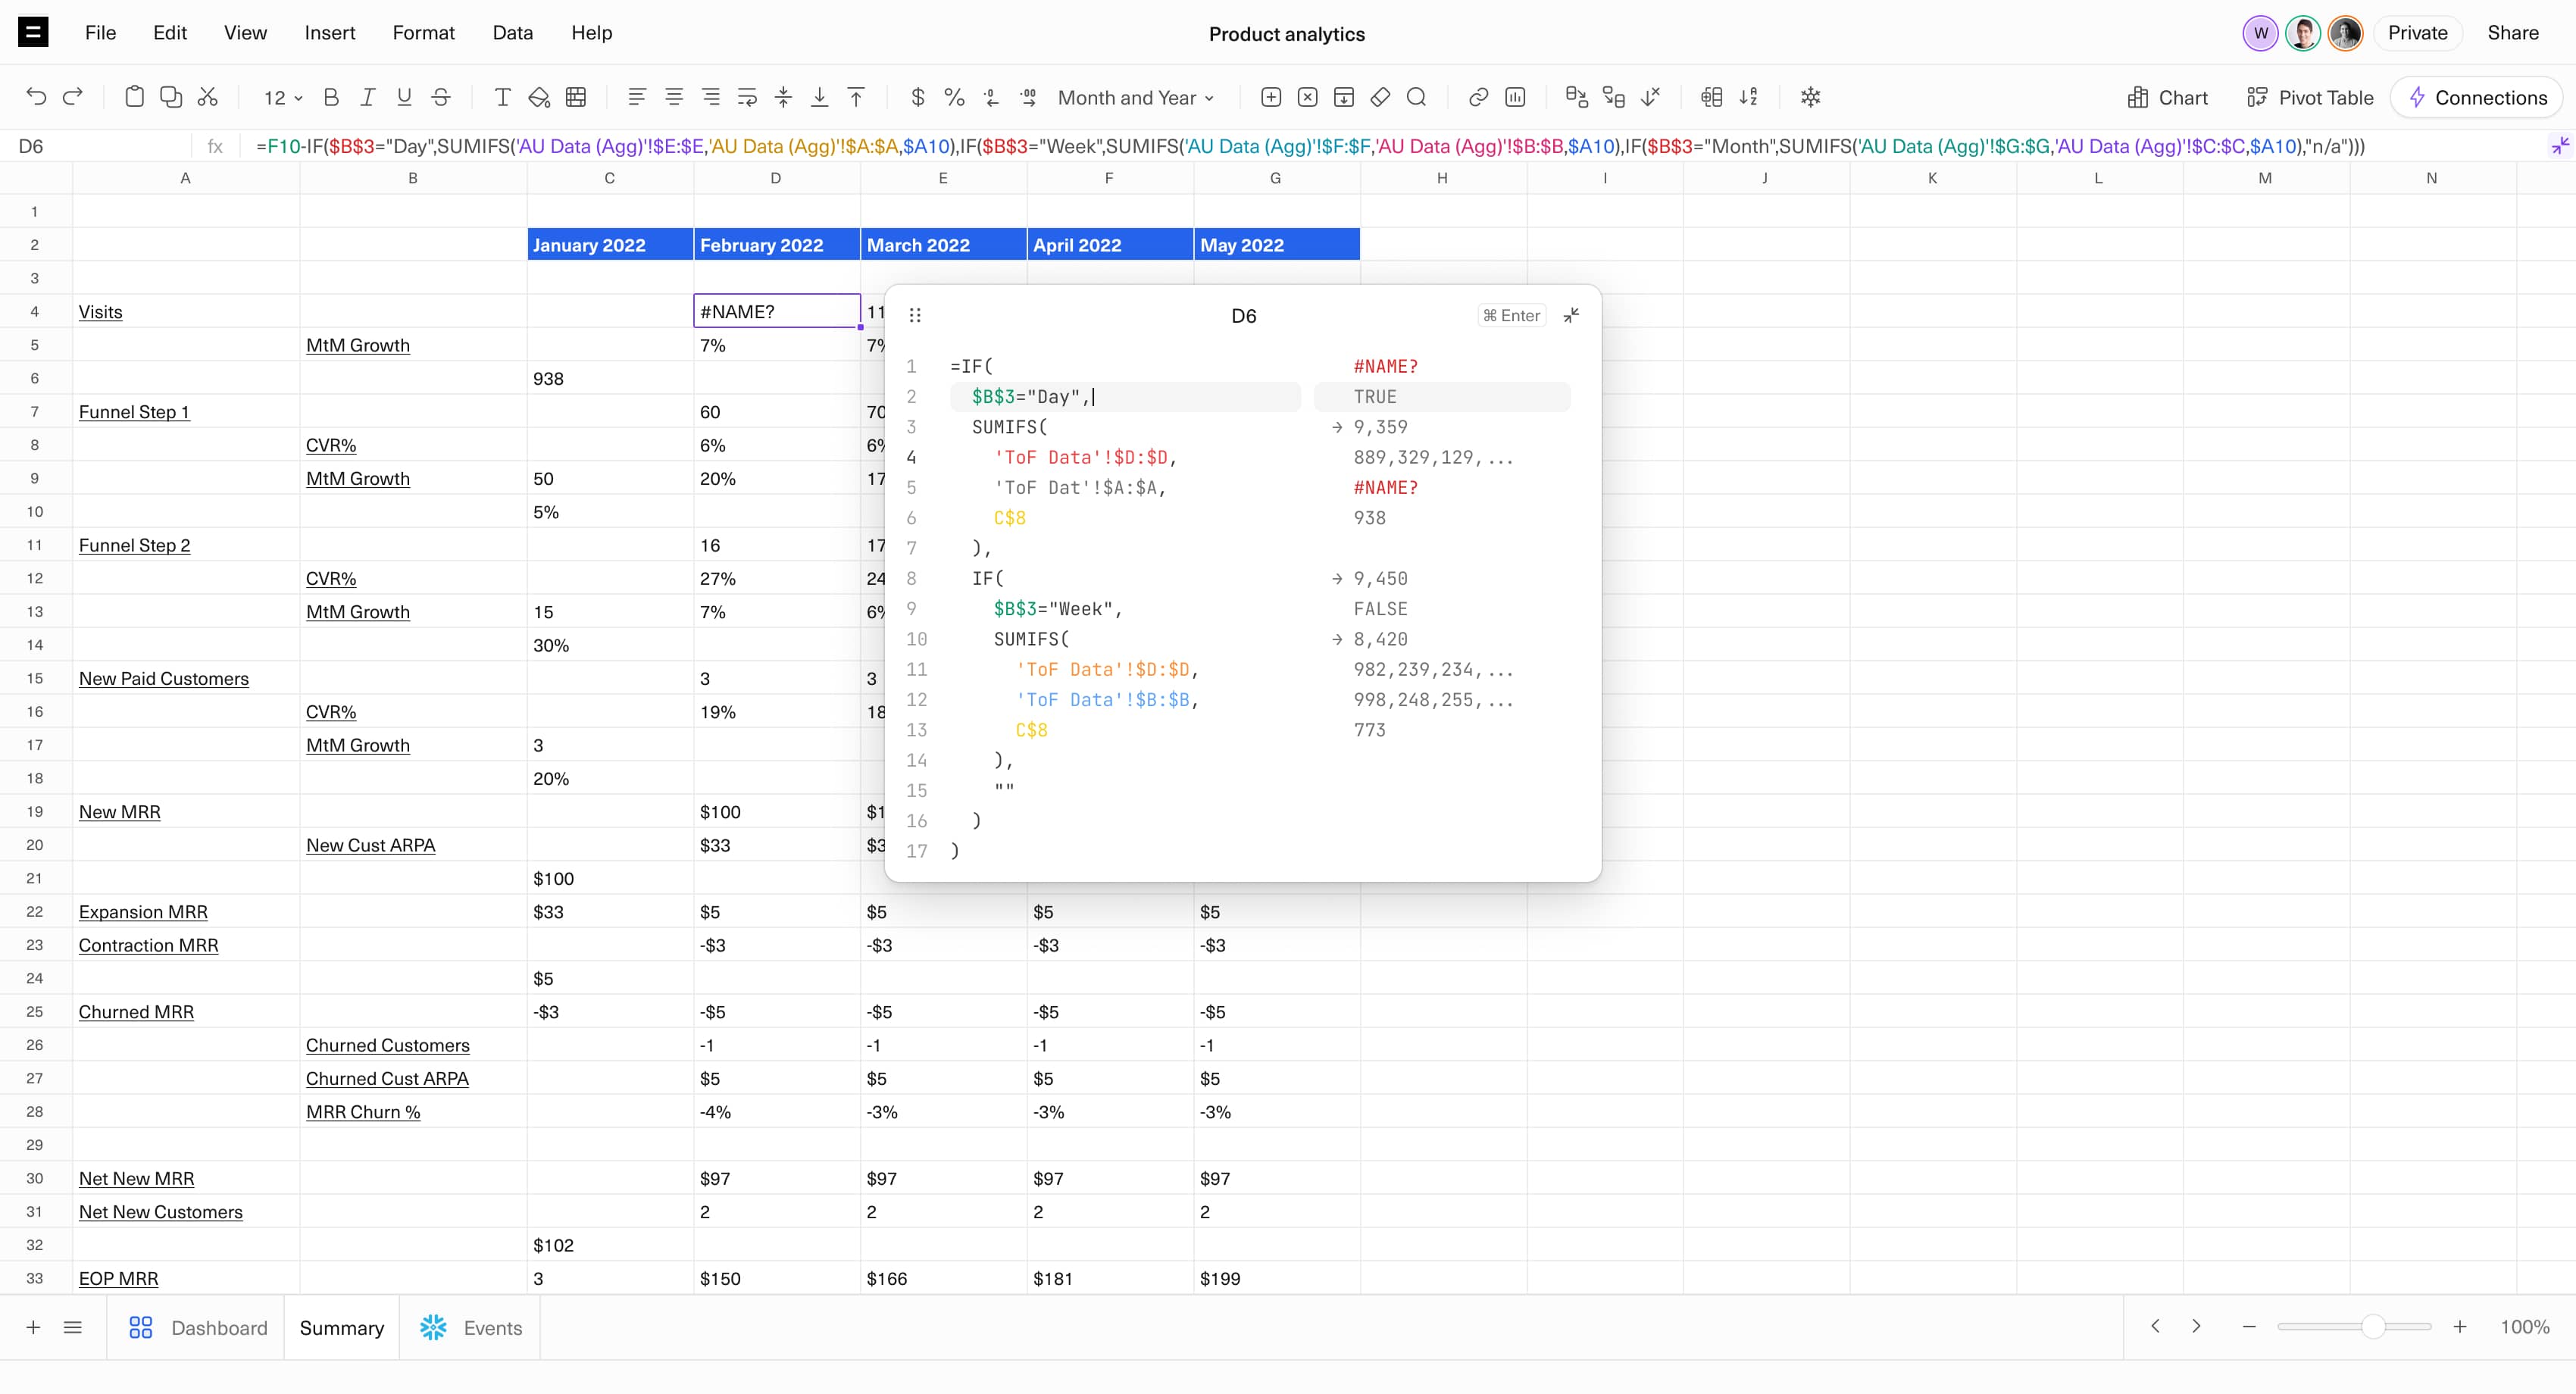
Formula Editor
Debug and edit spreadsheet formulas in a roomy, code-like canvas.
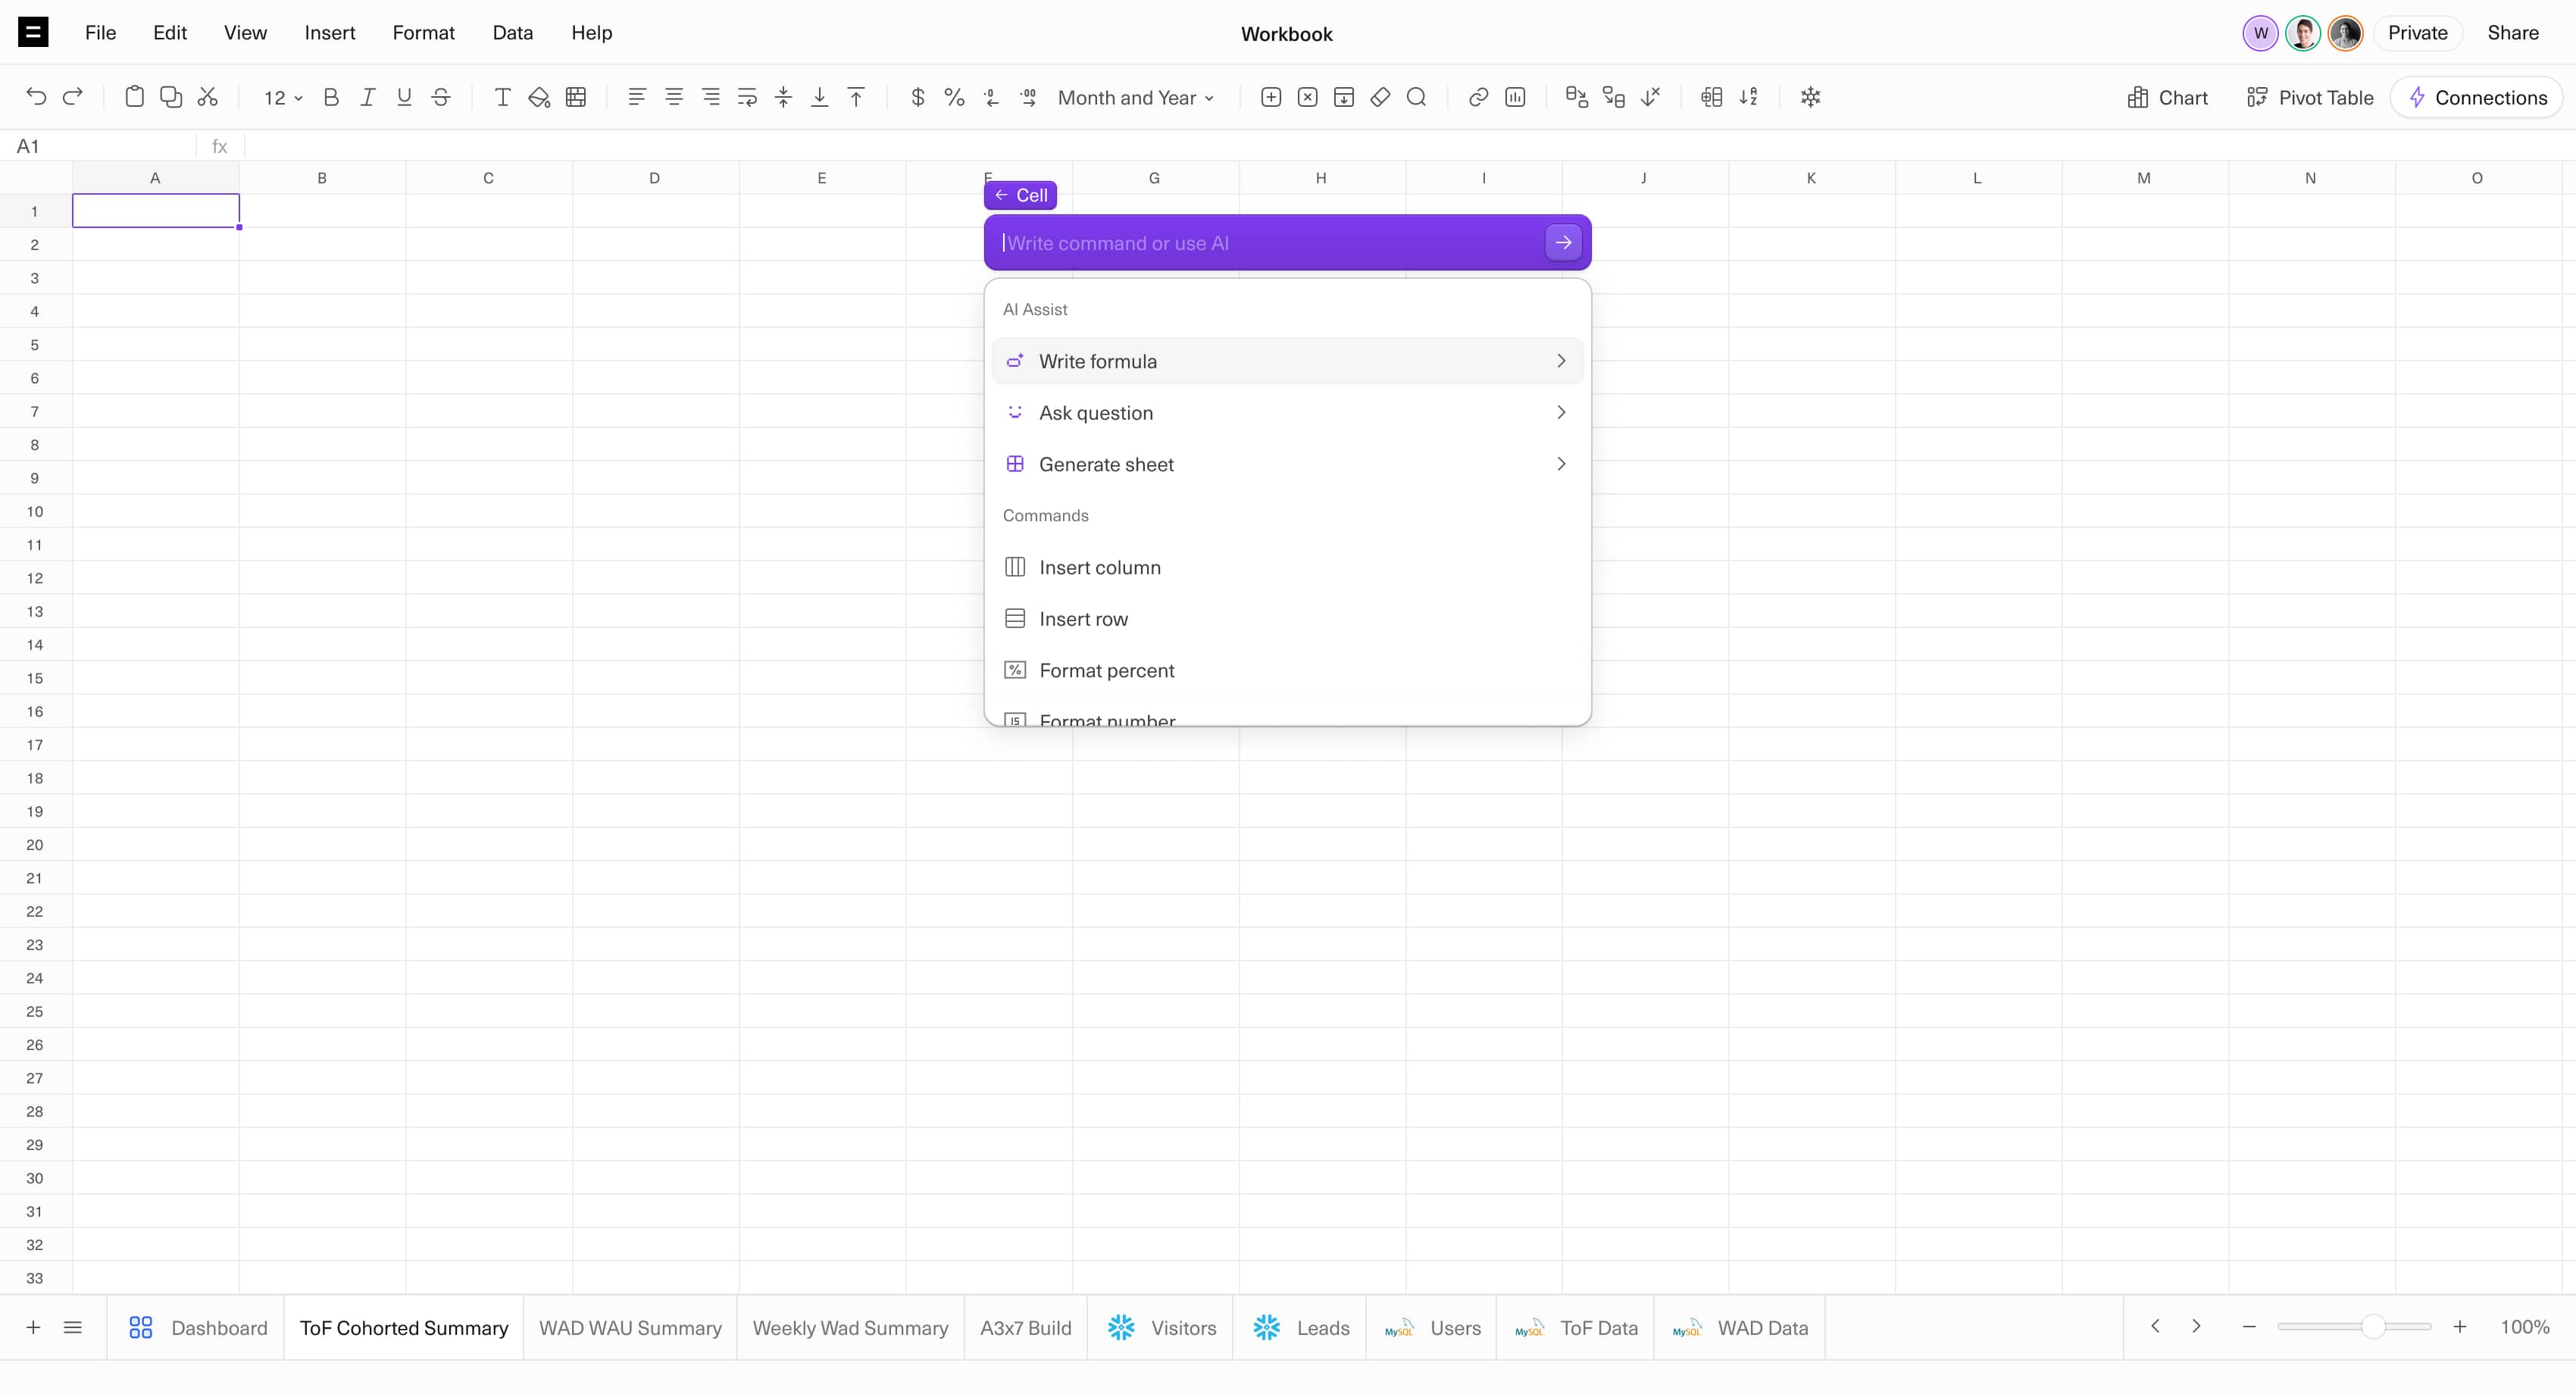
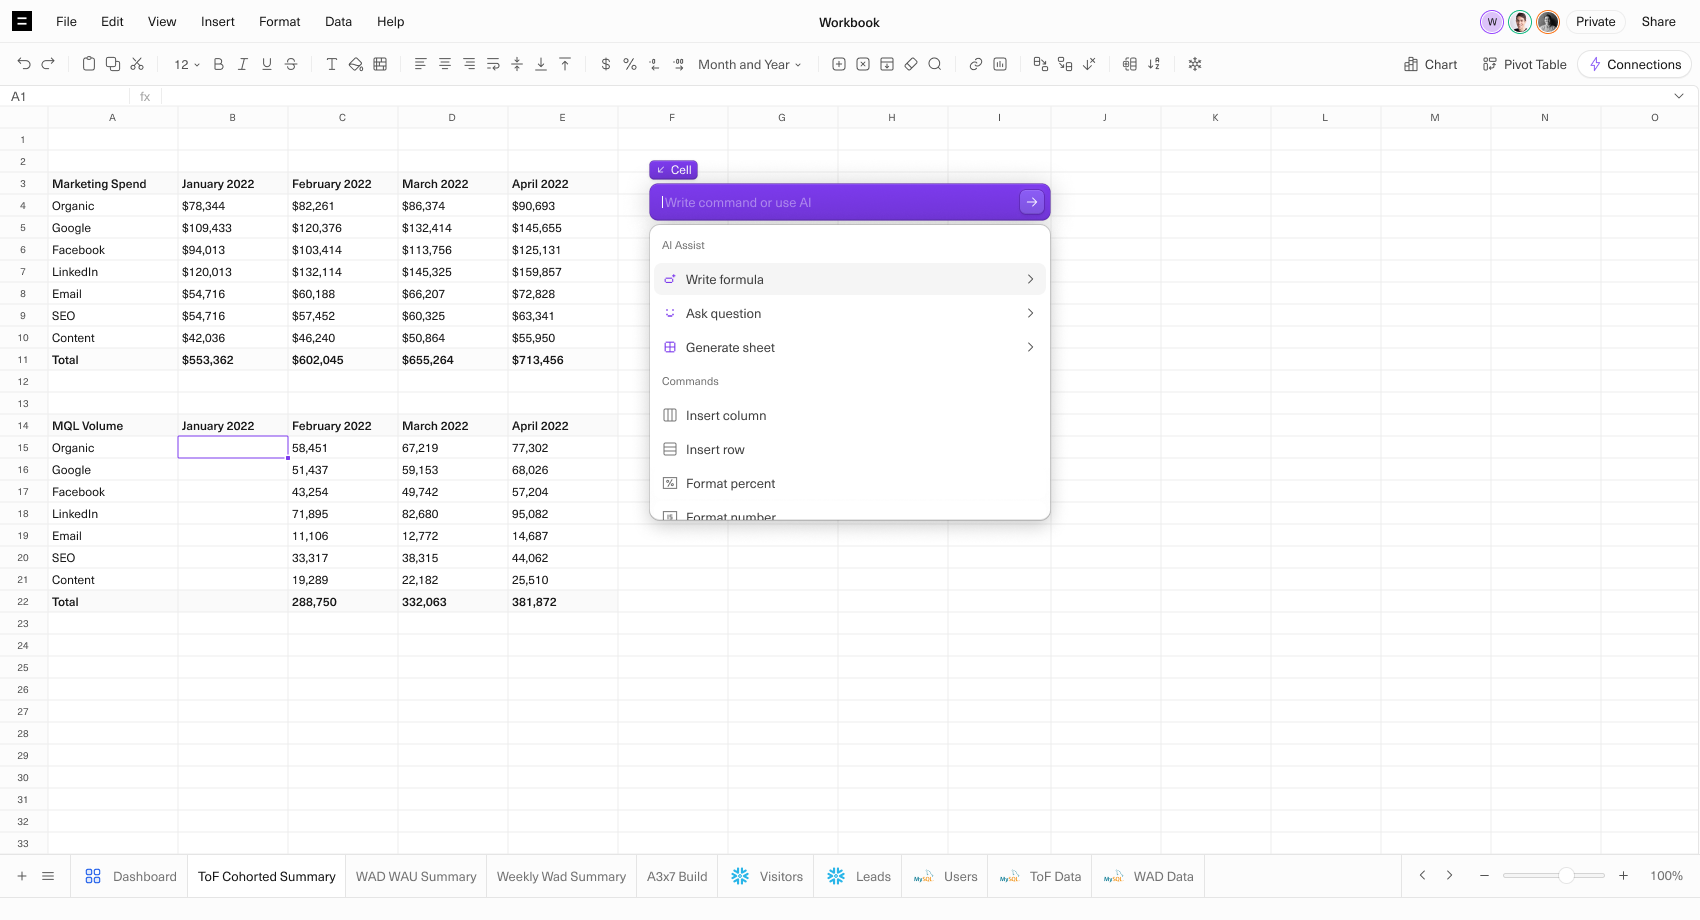
Command+K
Access any command and AI Assist with a single shortcut.
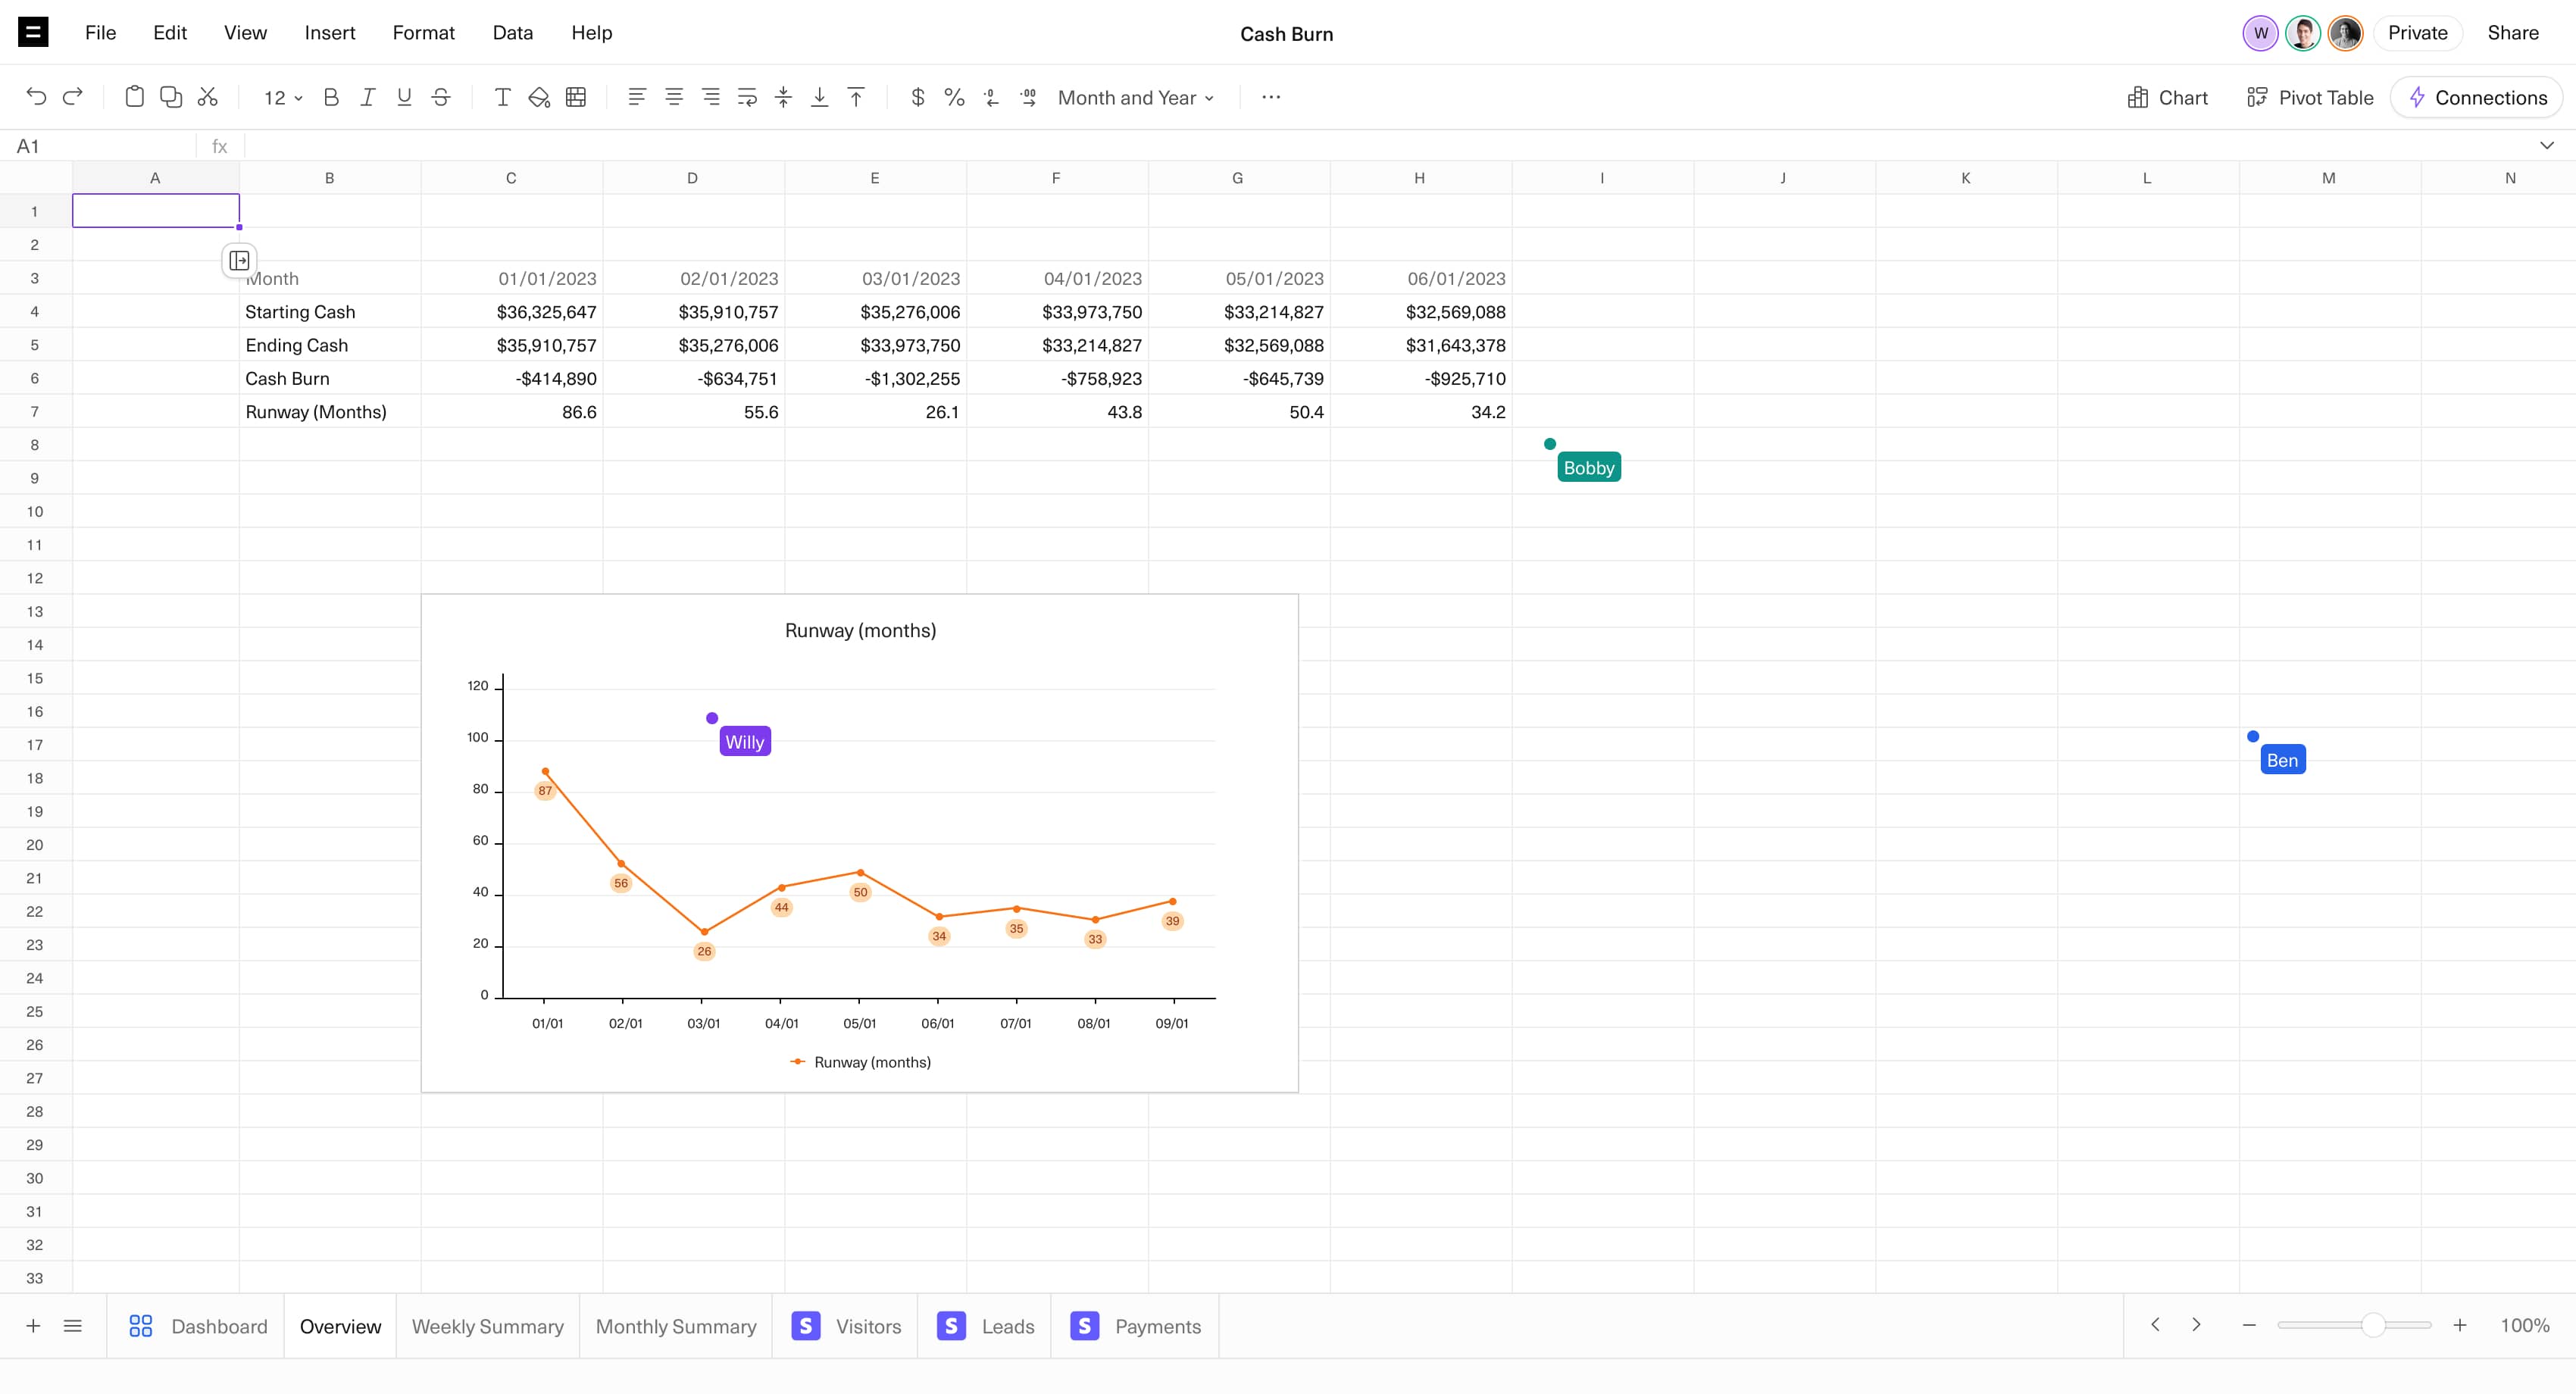
Multiplayer Collaboration
Work together in real-time with any Editor in your workspace.
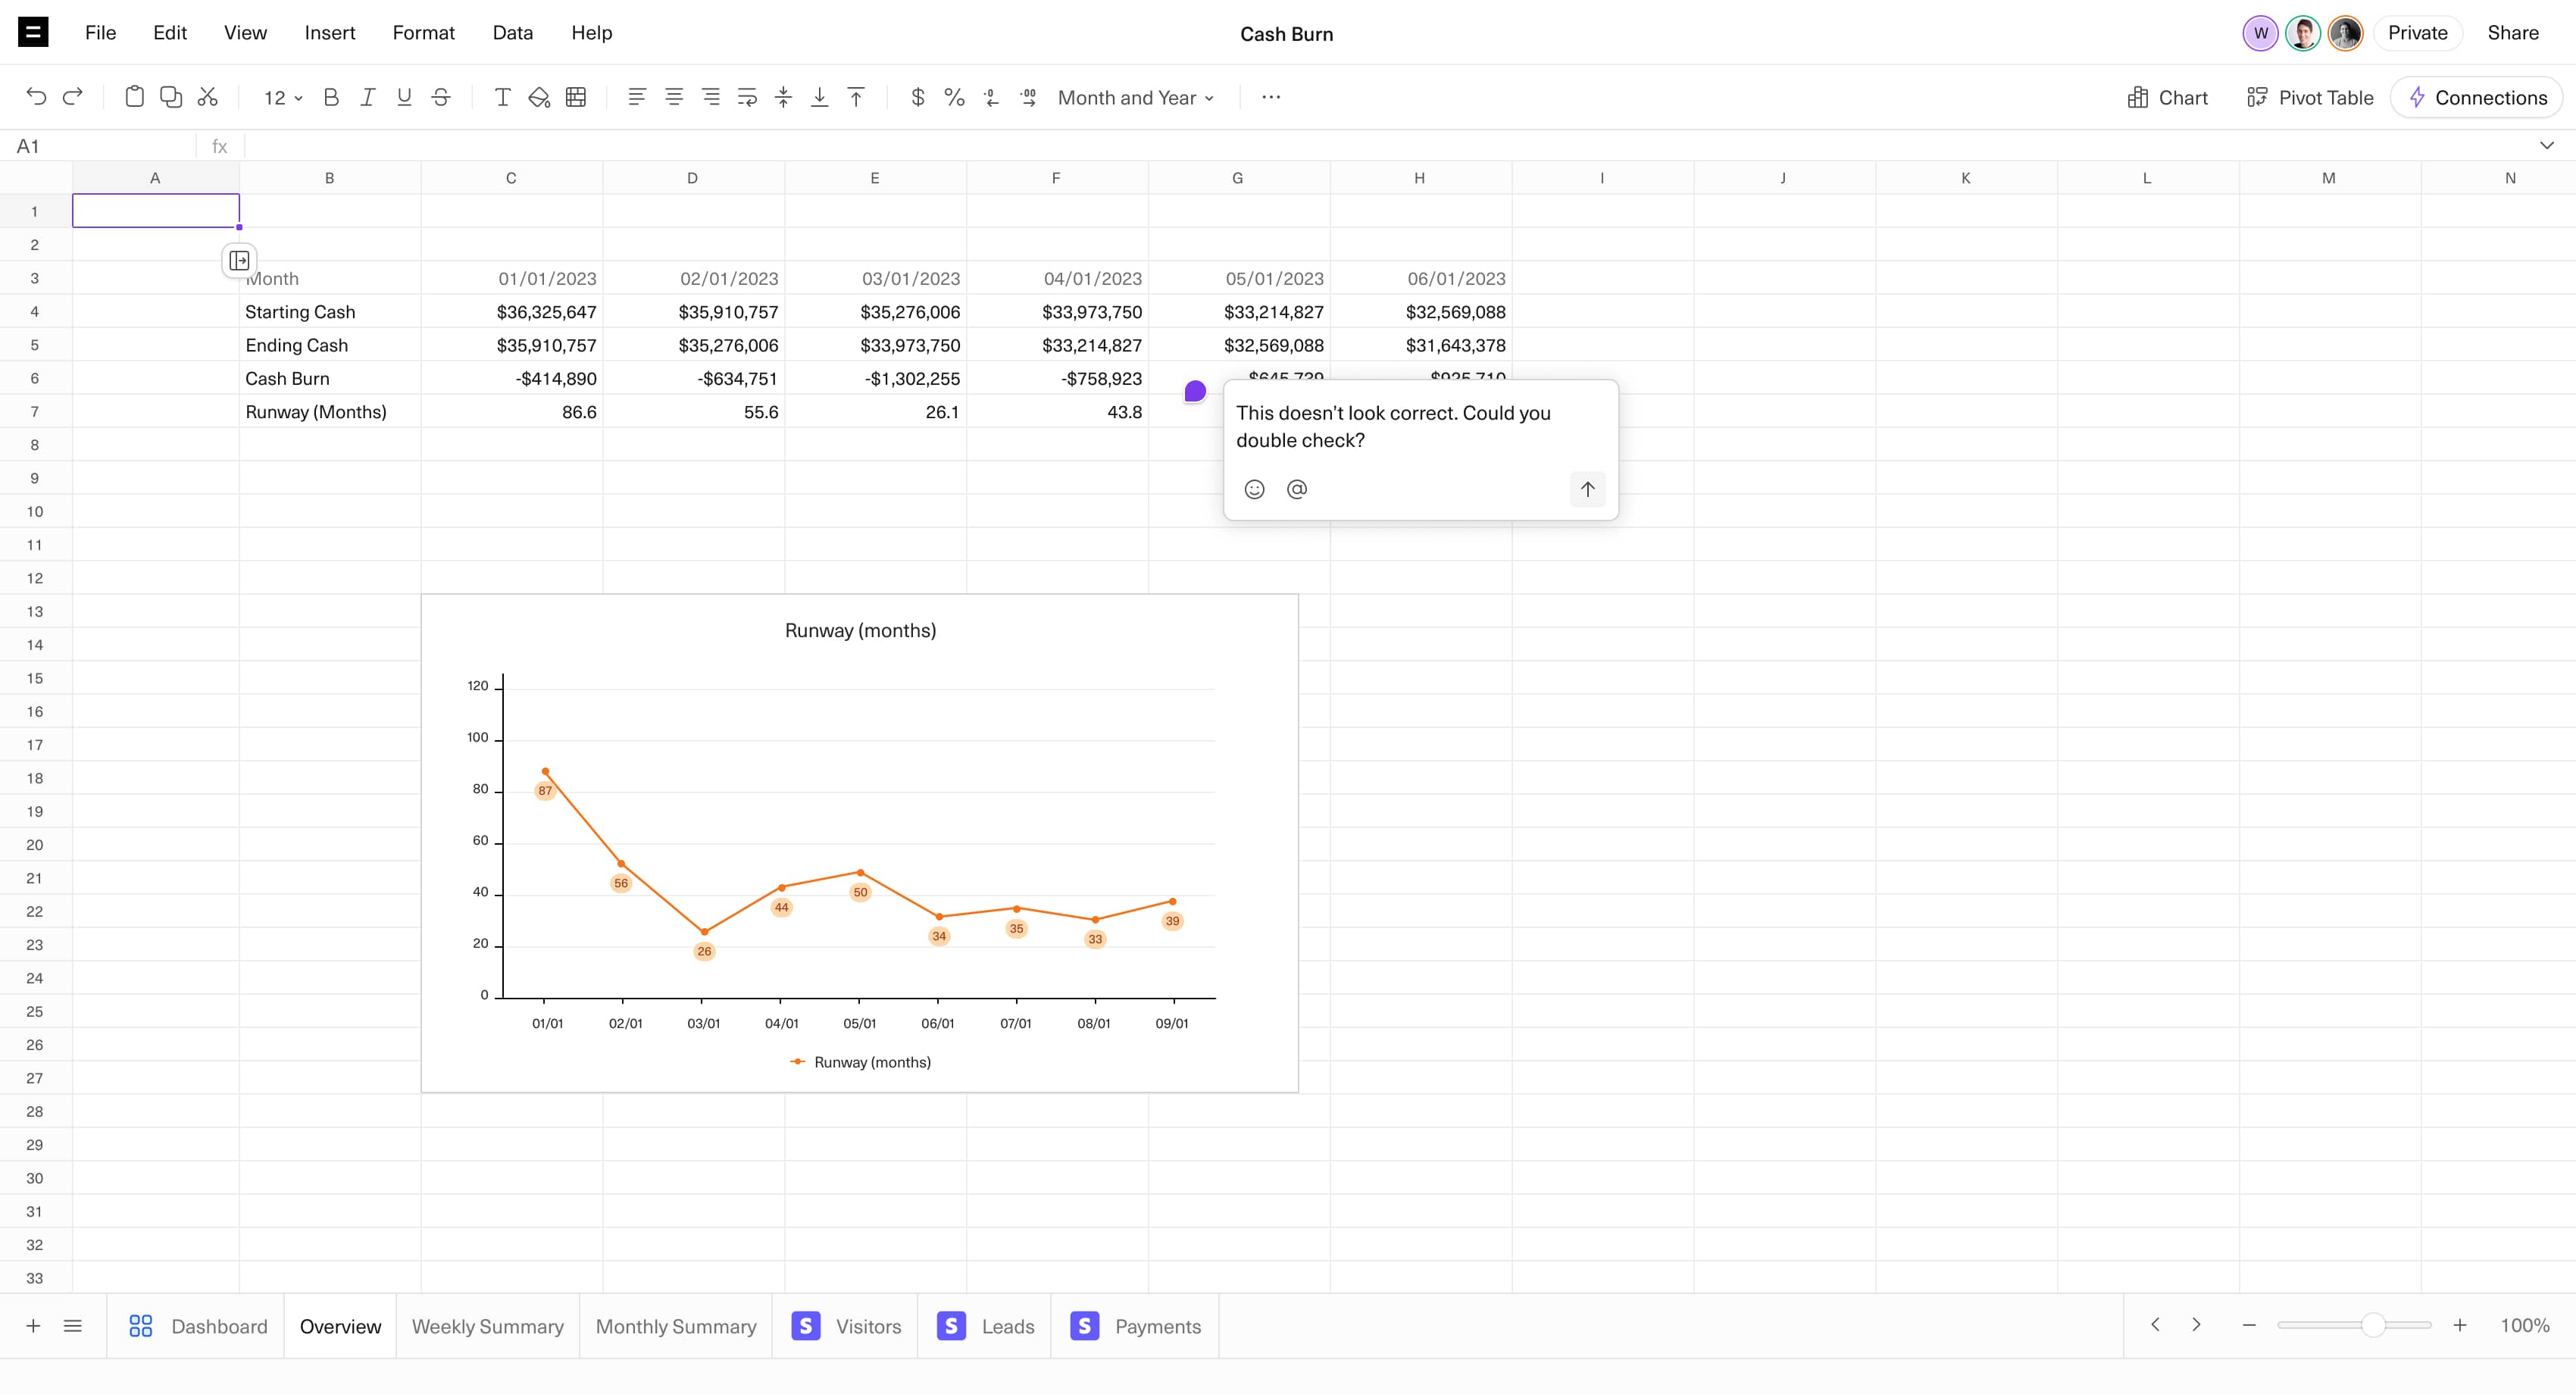
Comments
Add, reply, react to, and resolve comments on any cell or chart.
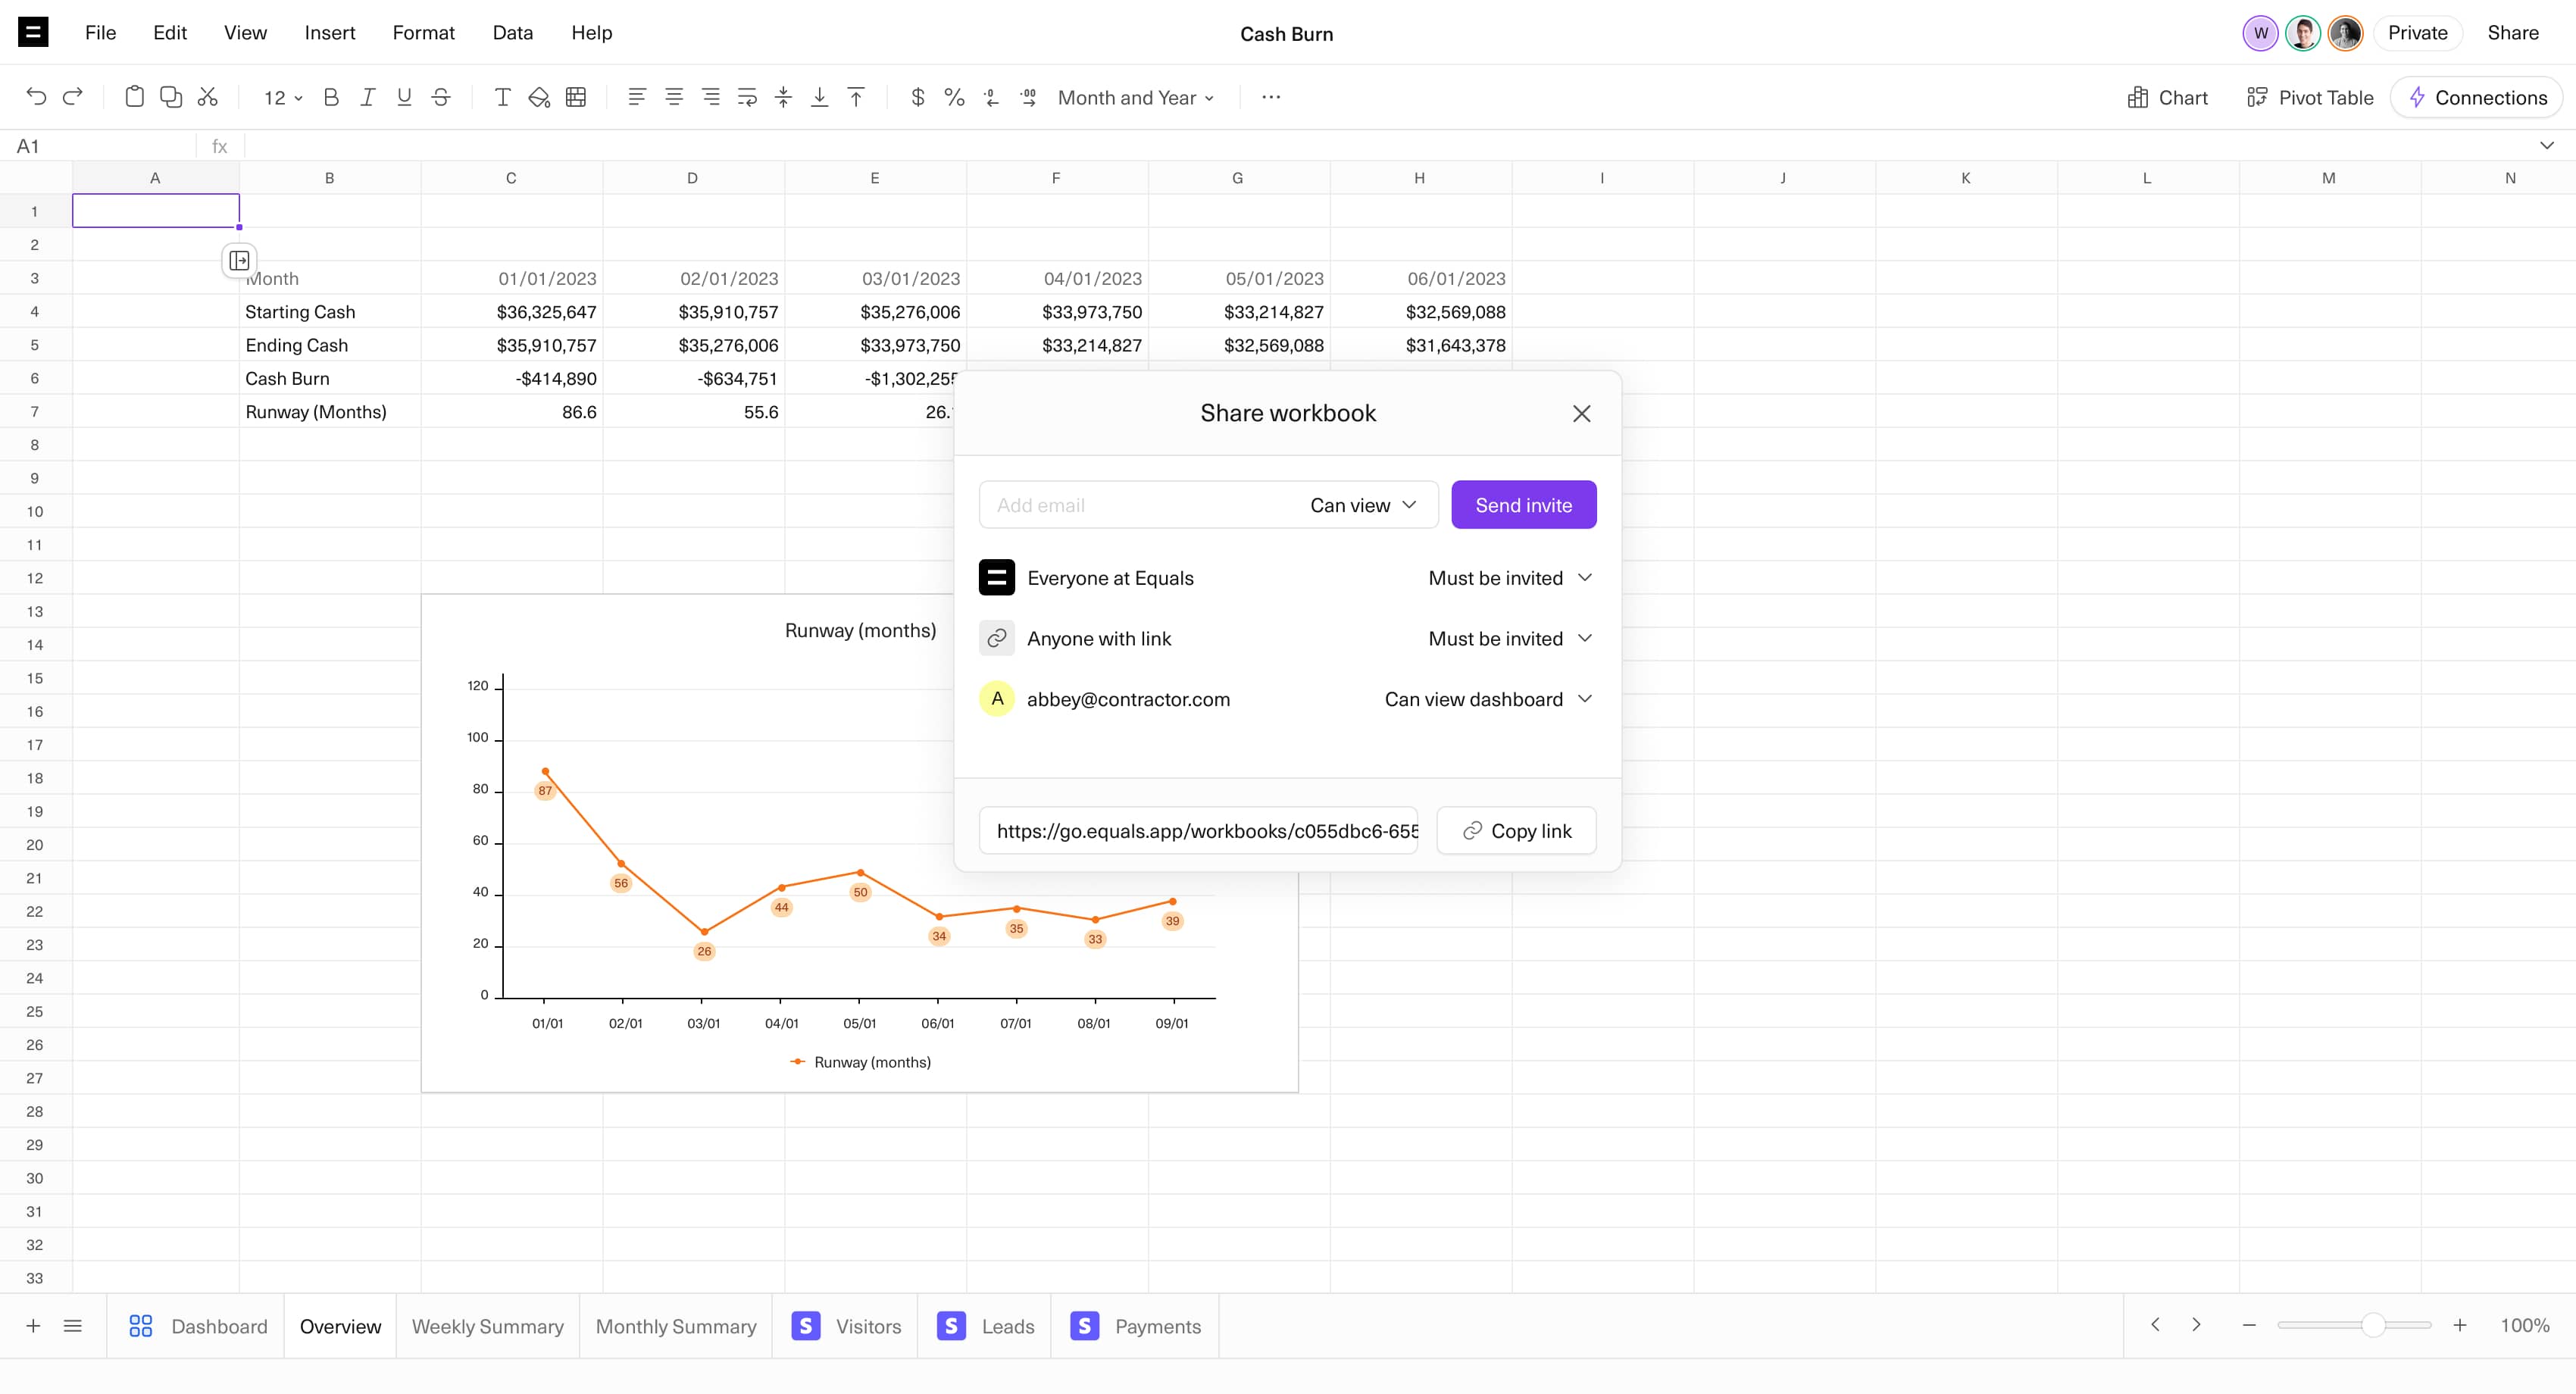
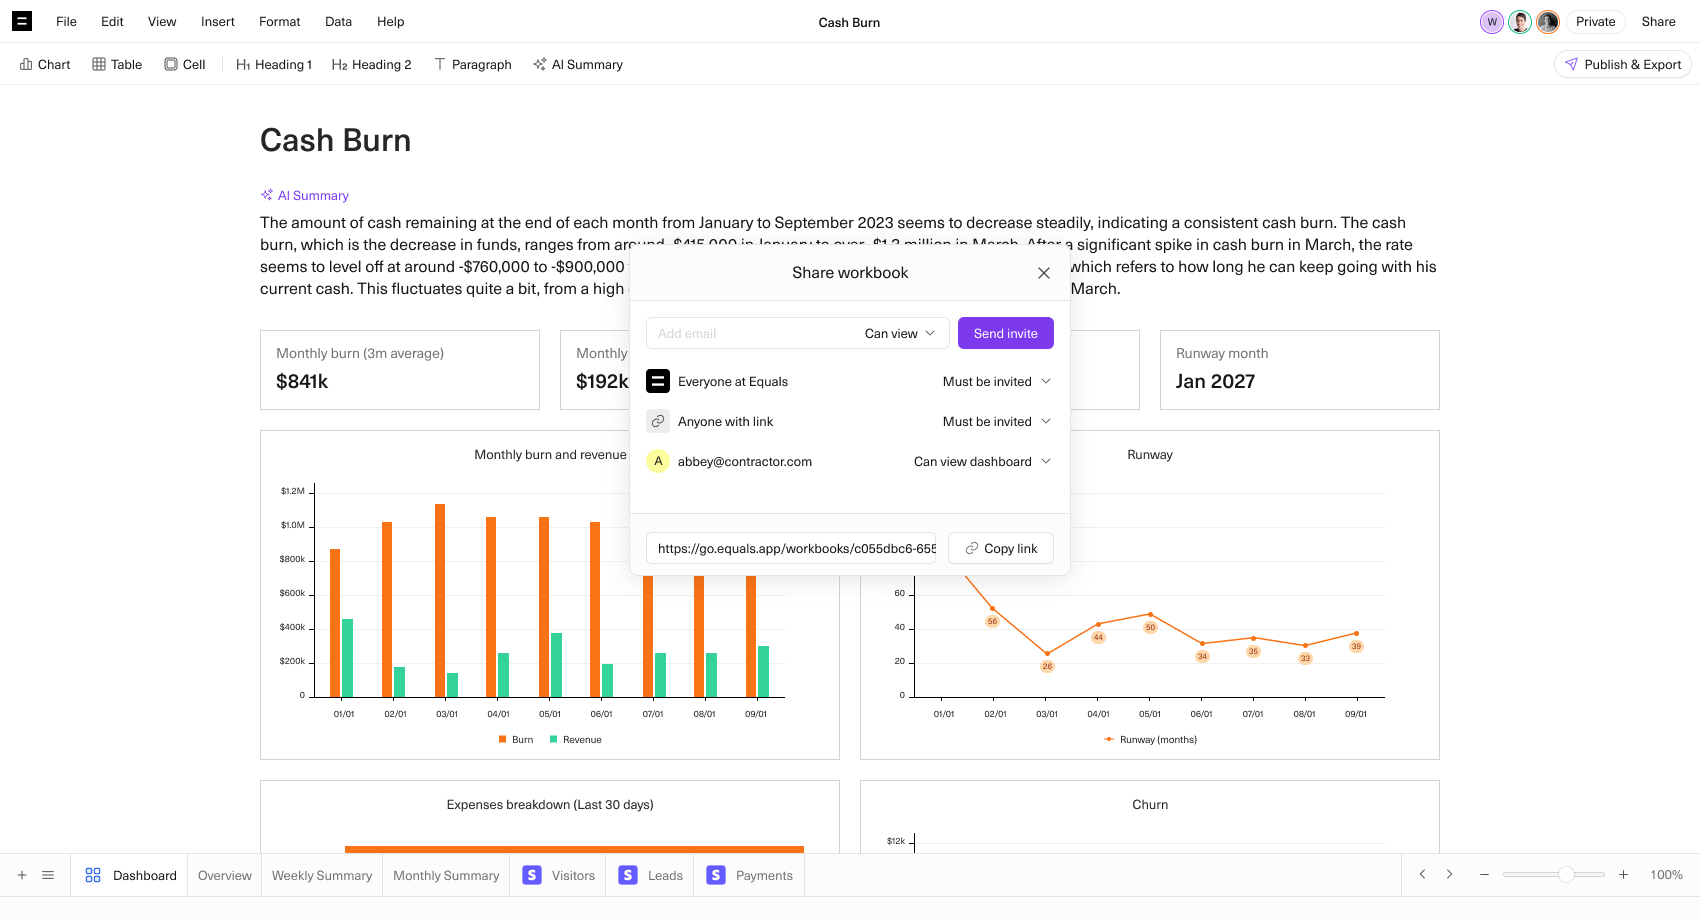
Access Controls
Set permissions to determine users’ level of access to your workbook or workspace.
Report
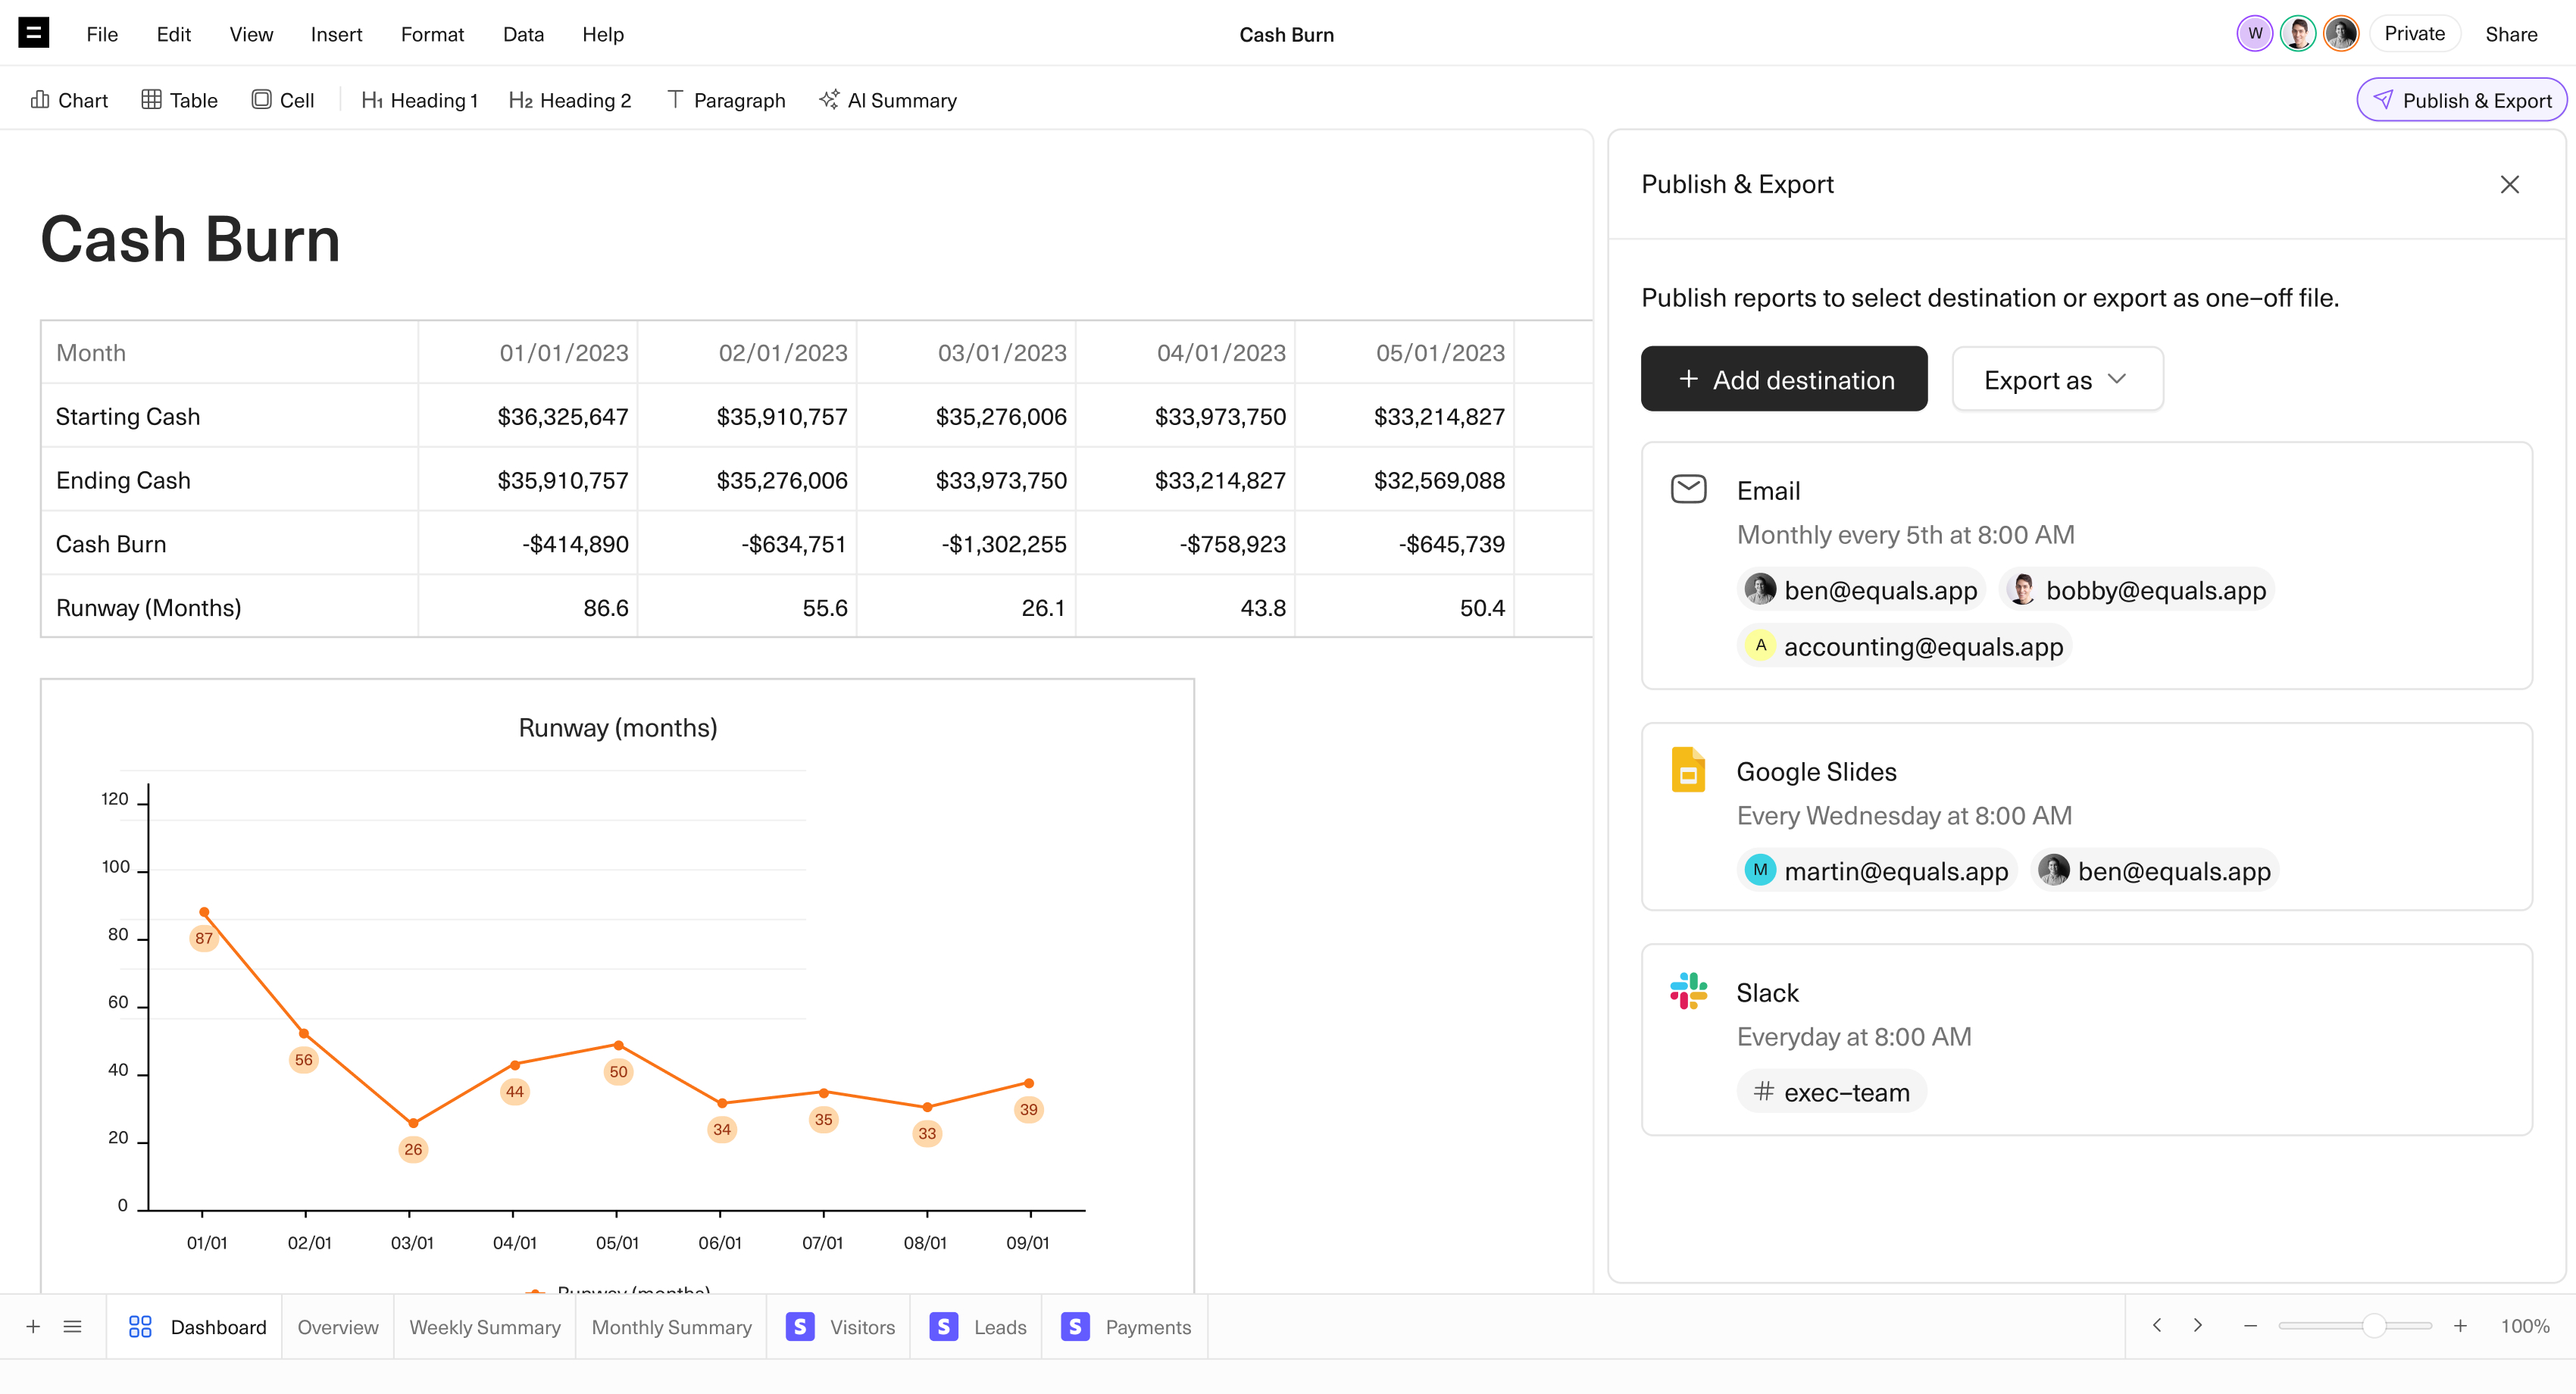
Instantly turn spreadsheets into dashboards and auto-distribute up-to-date reports – all in a few clicks.
Learn More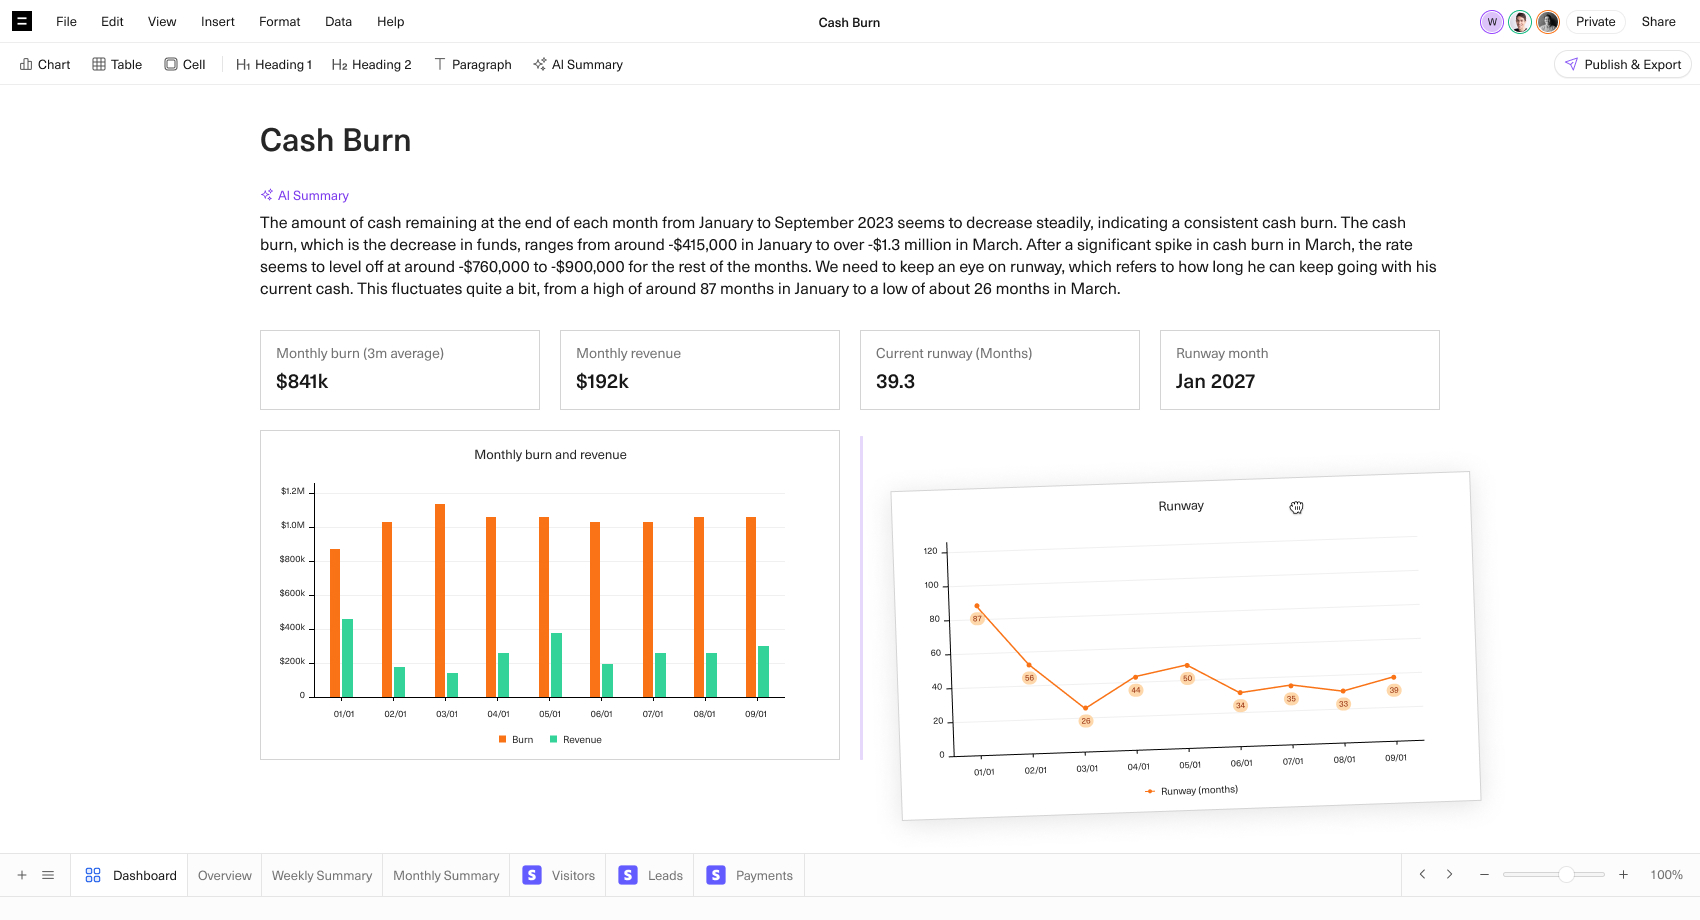
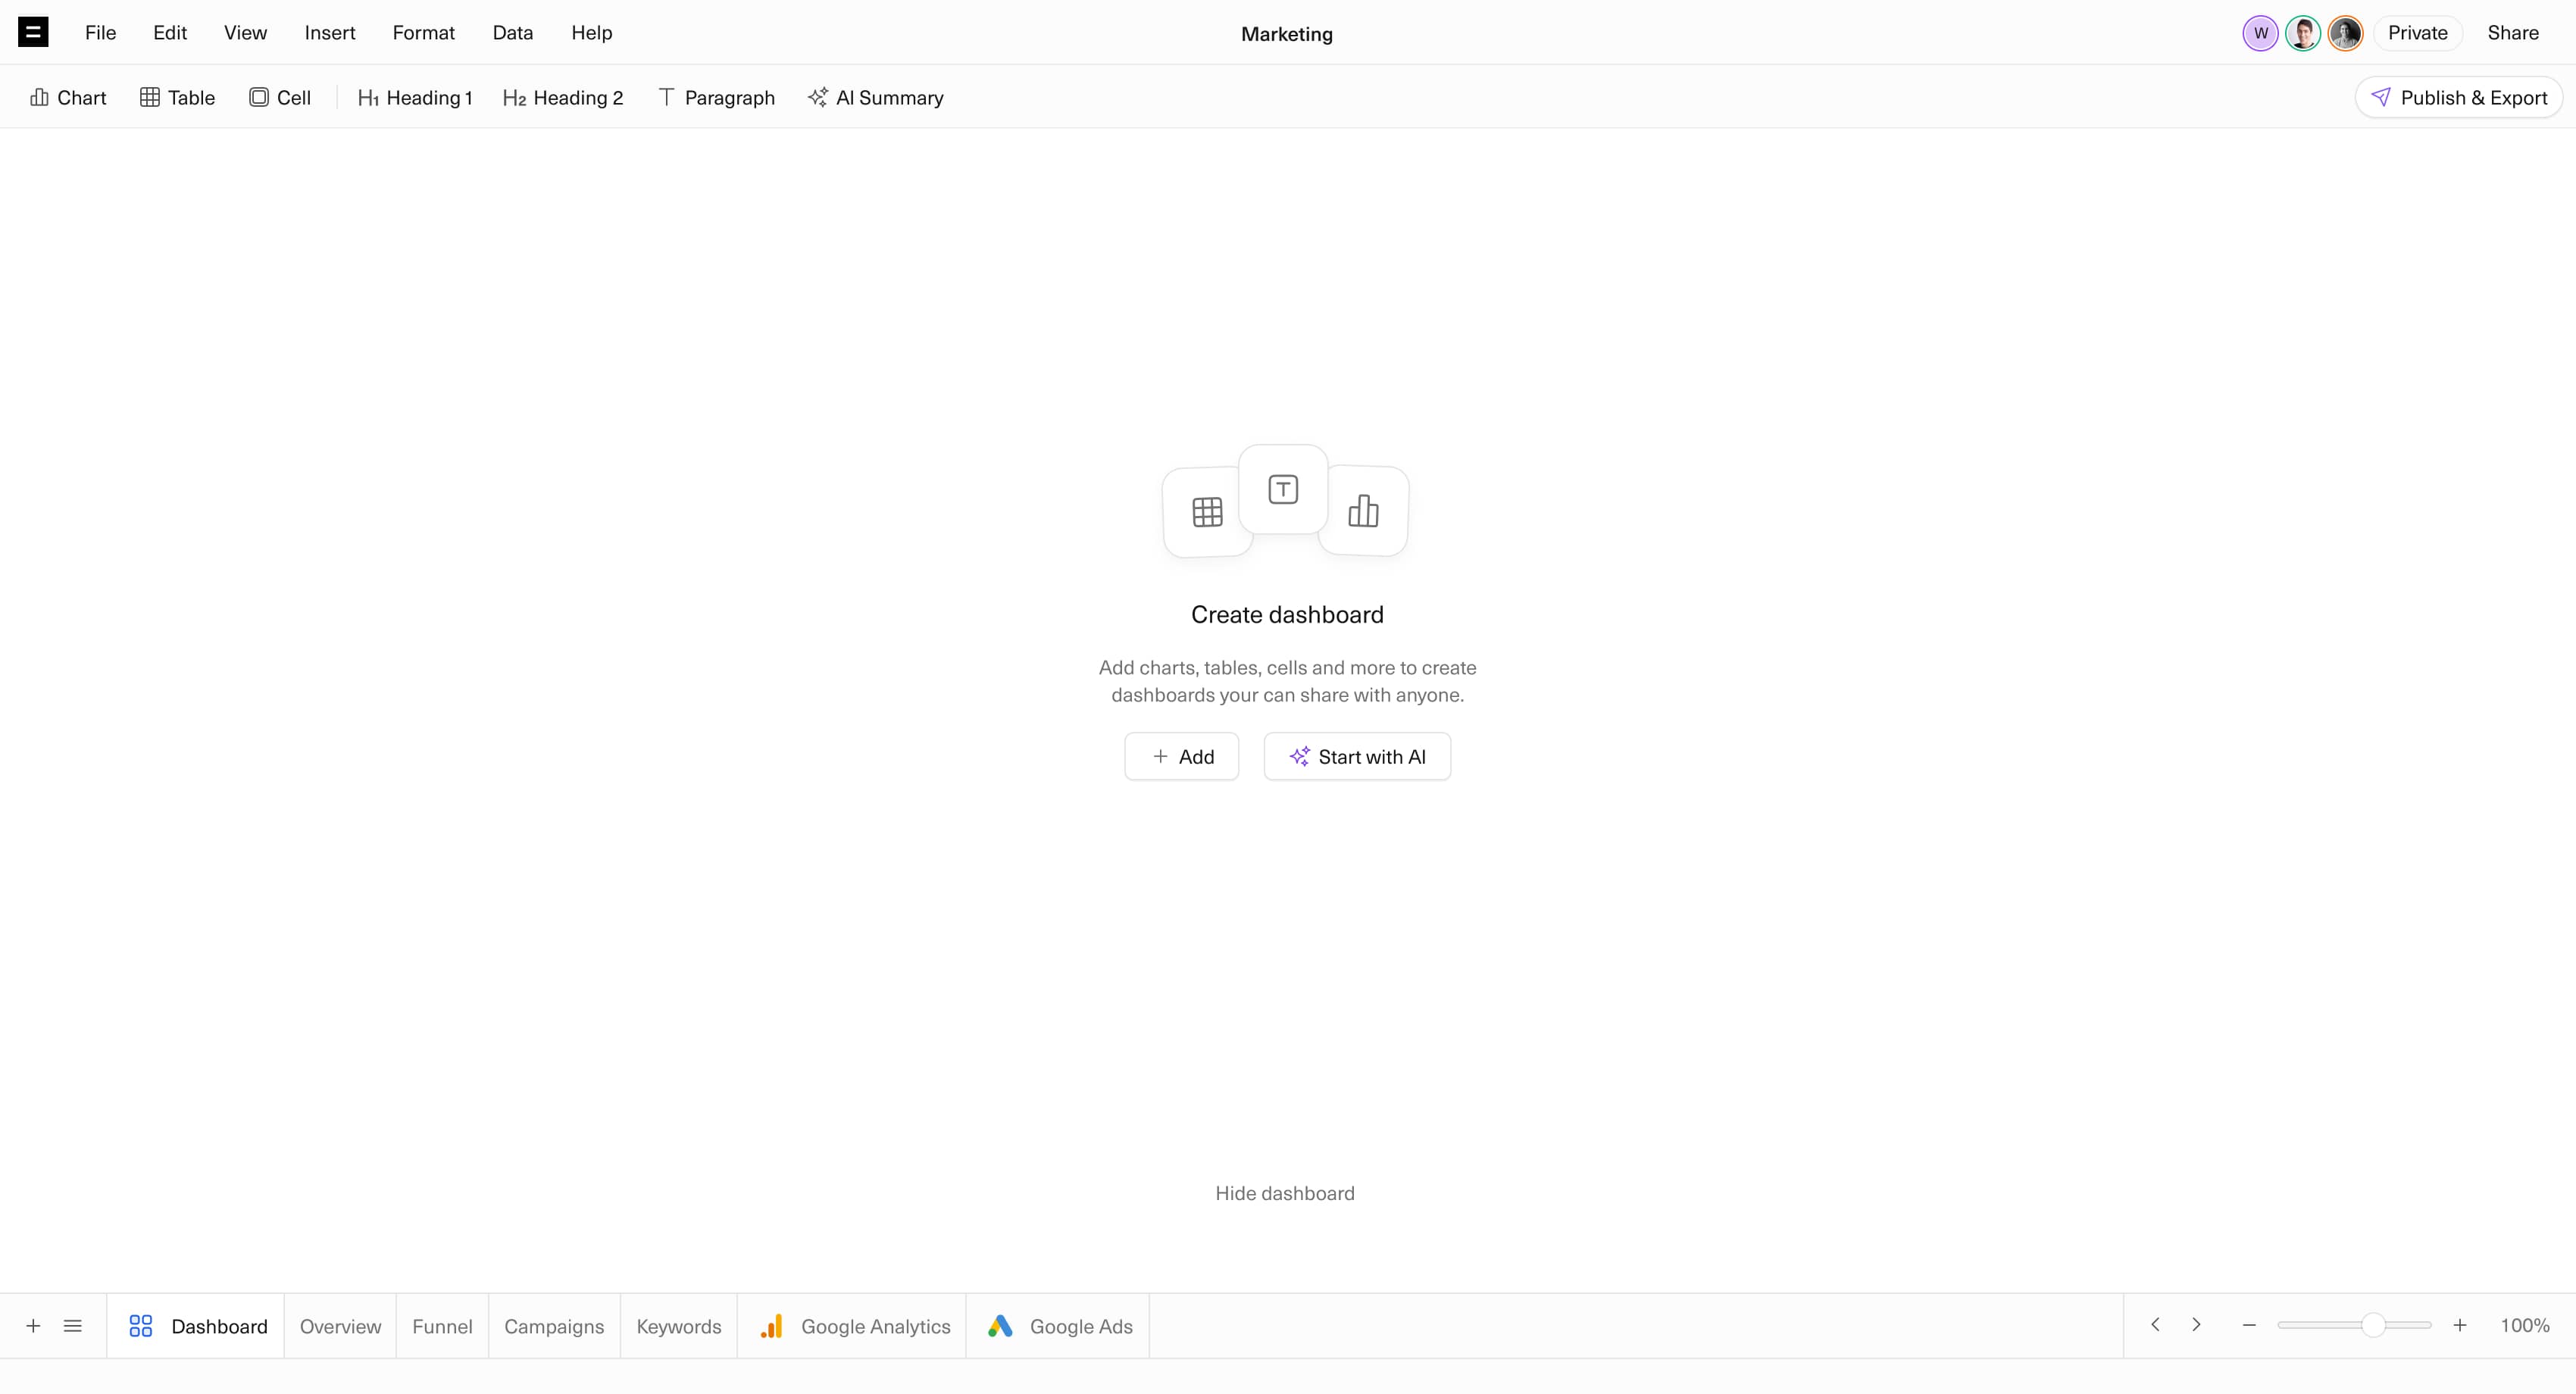
Dashboards
Instantly turn spreadsheets into dashboards with charts, cells, tables, and AI summaries.
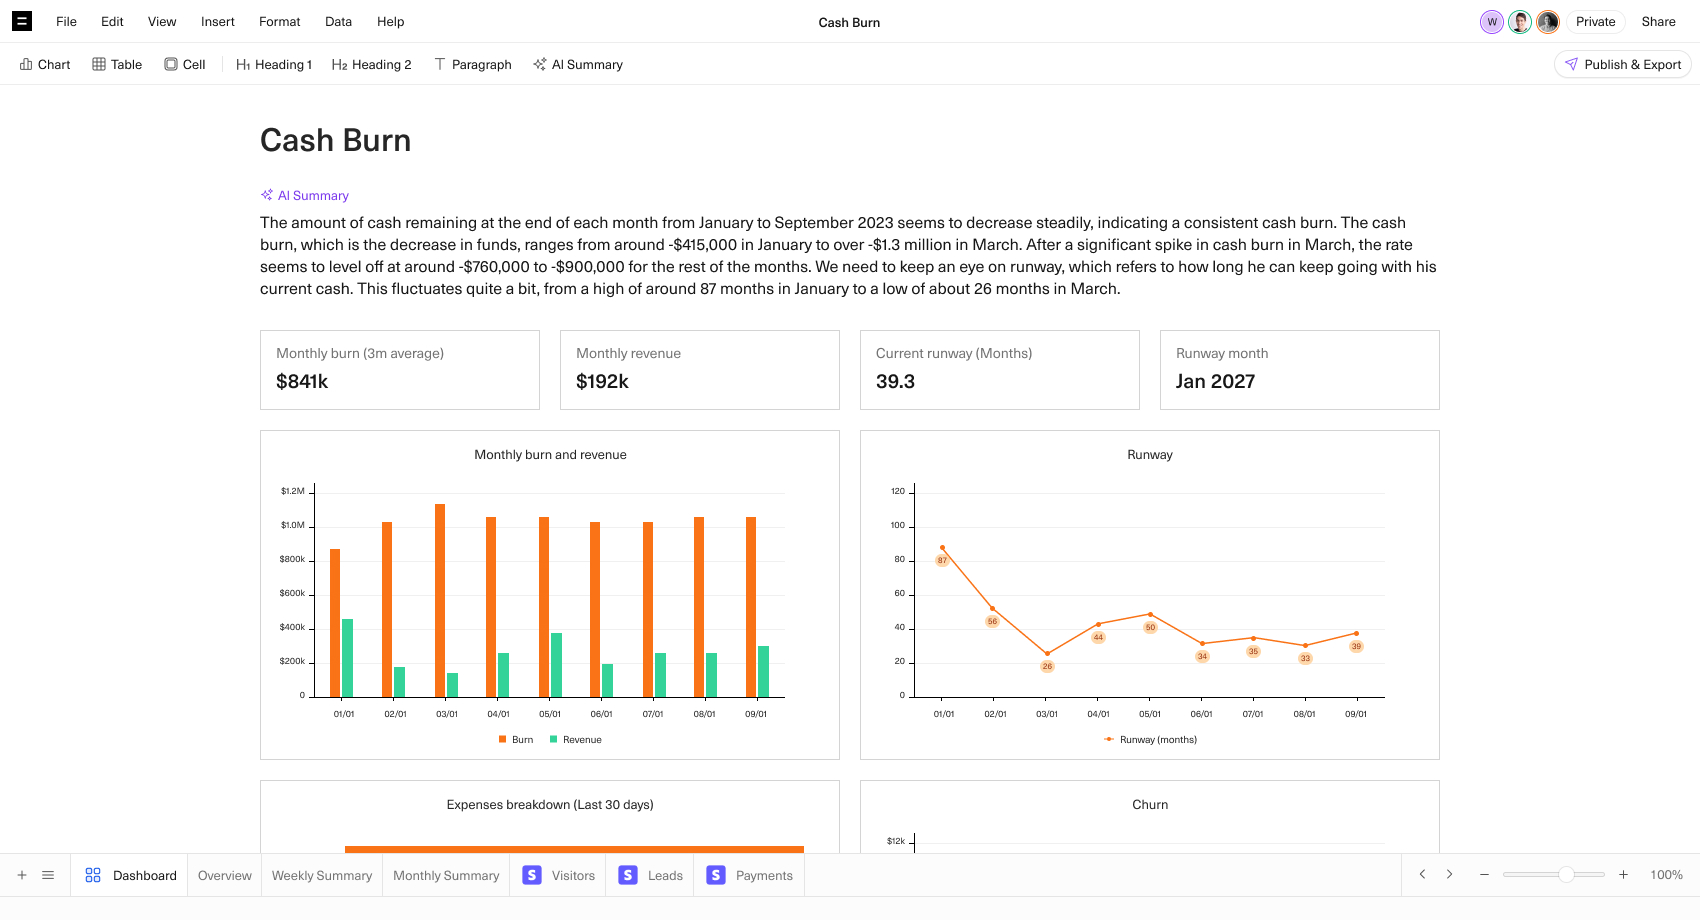
AI Summaries
Auto-generate text summaries of charts and tables with AI Assist.
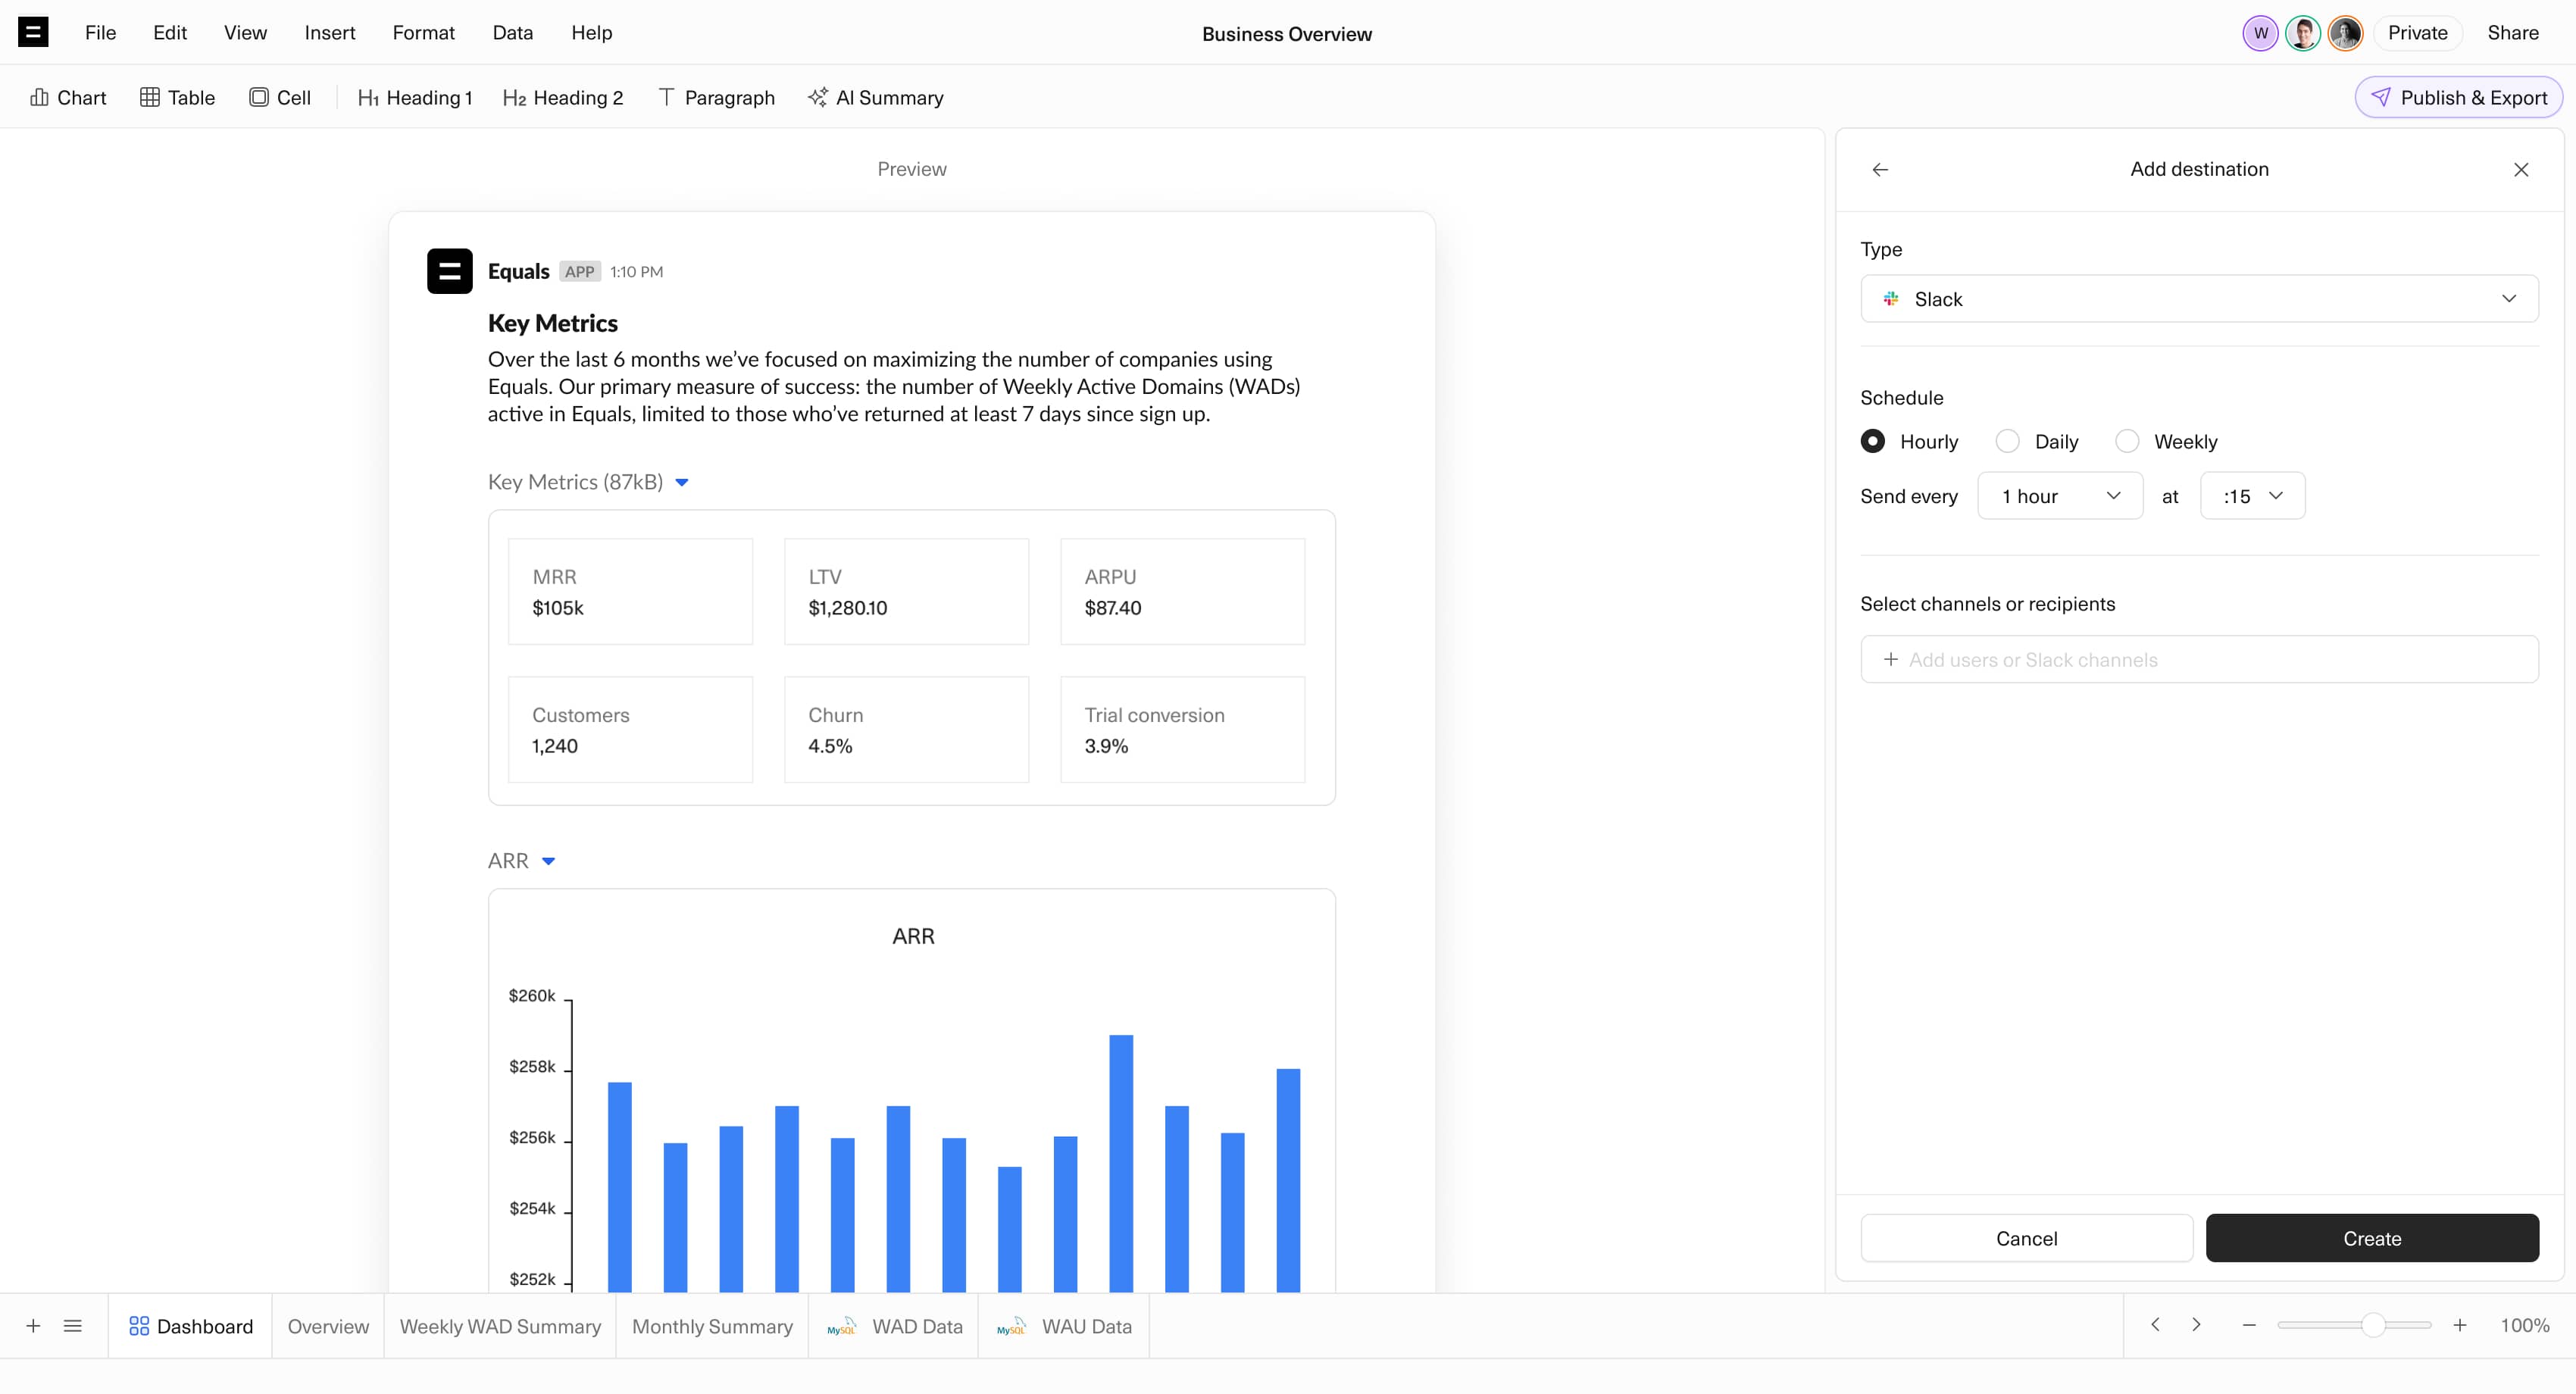
Post to Slack
Post a snapshot of your dashboard to Slack channels–weekly, daily or hourly.
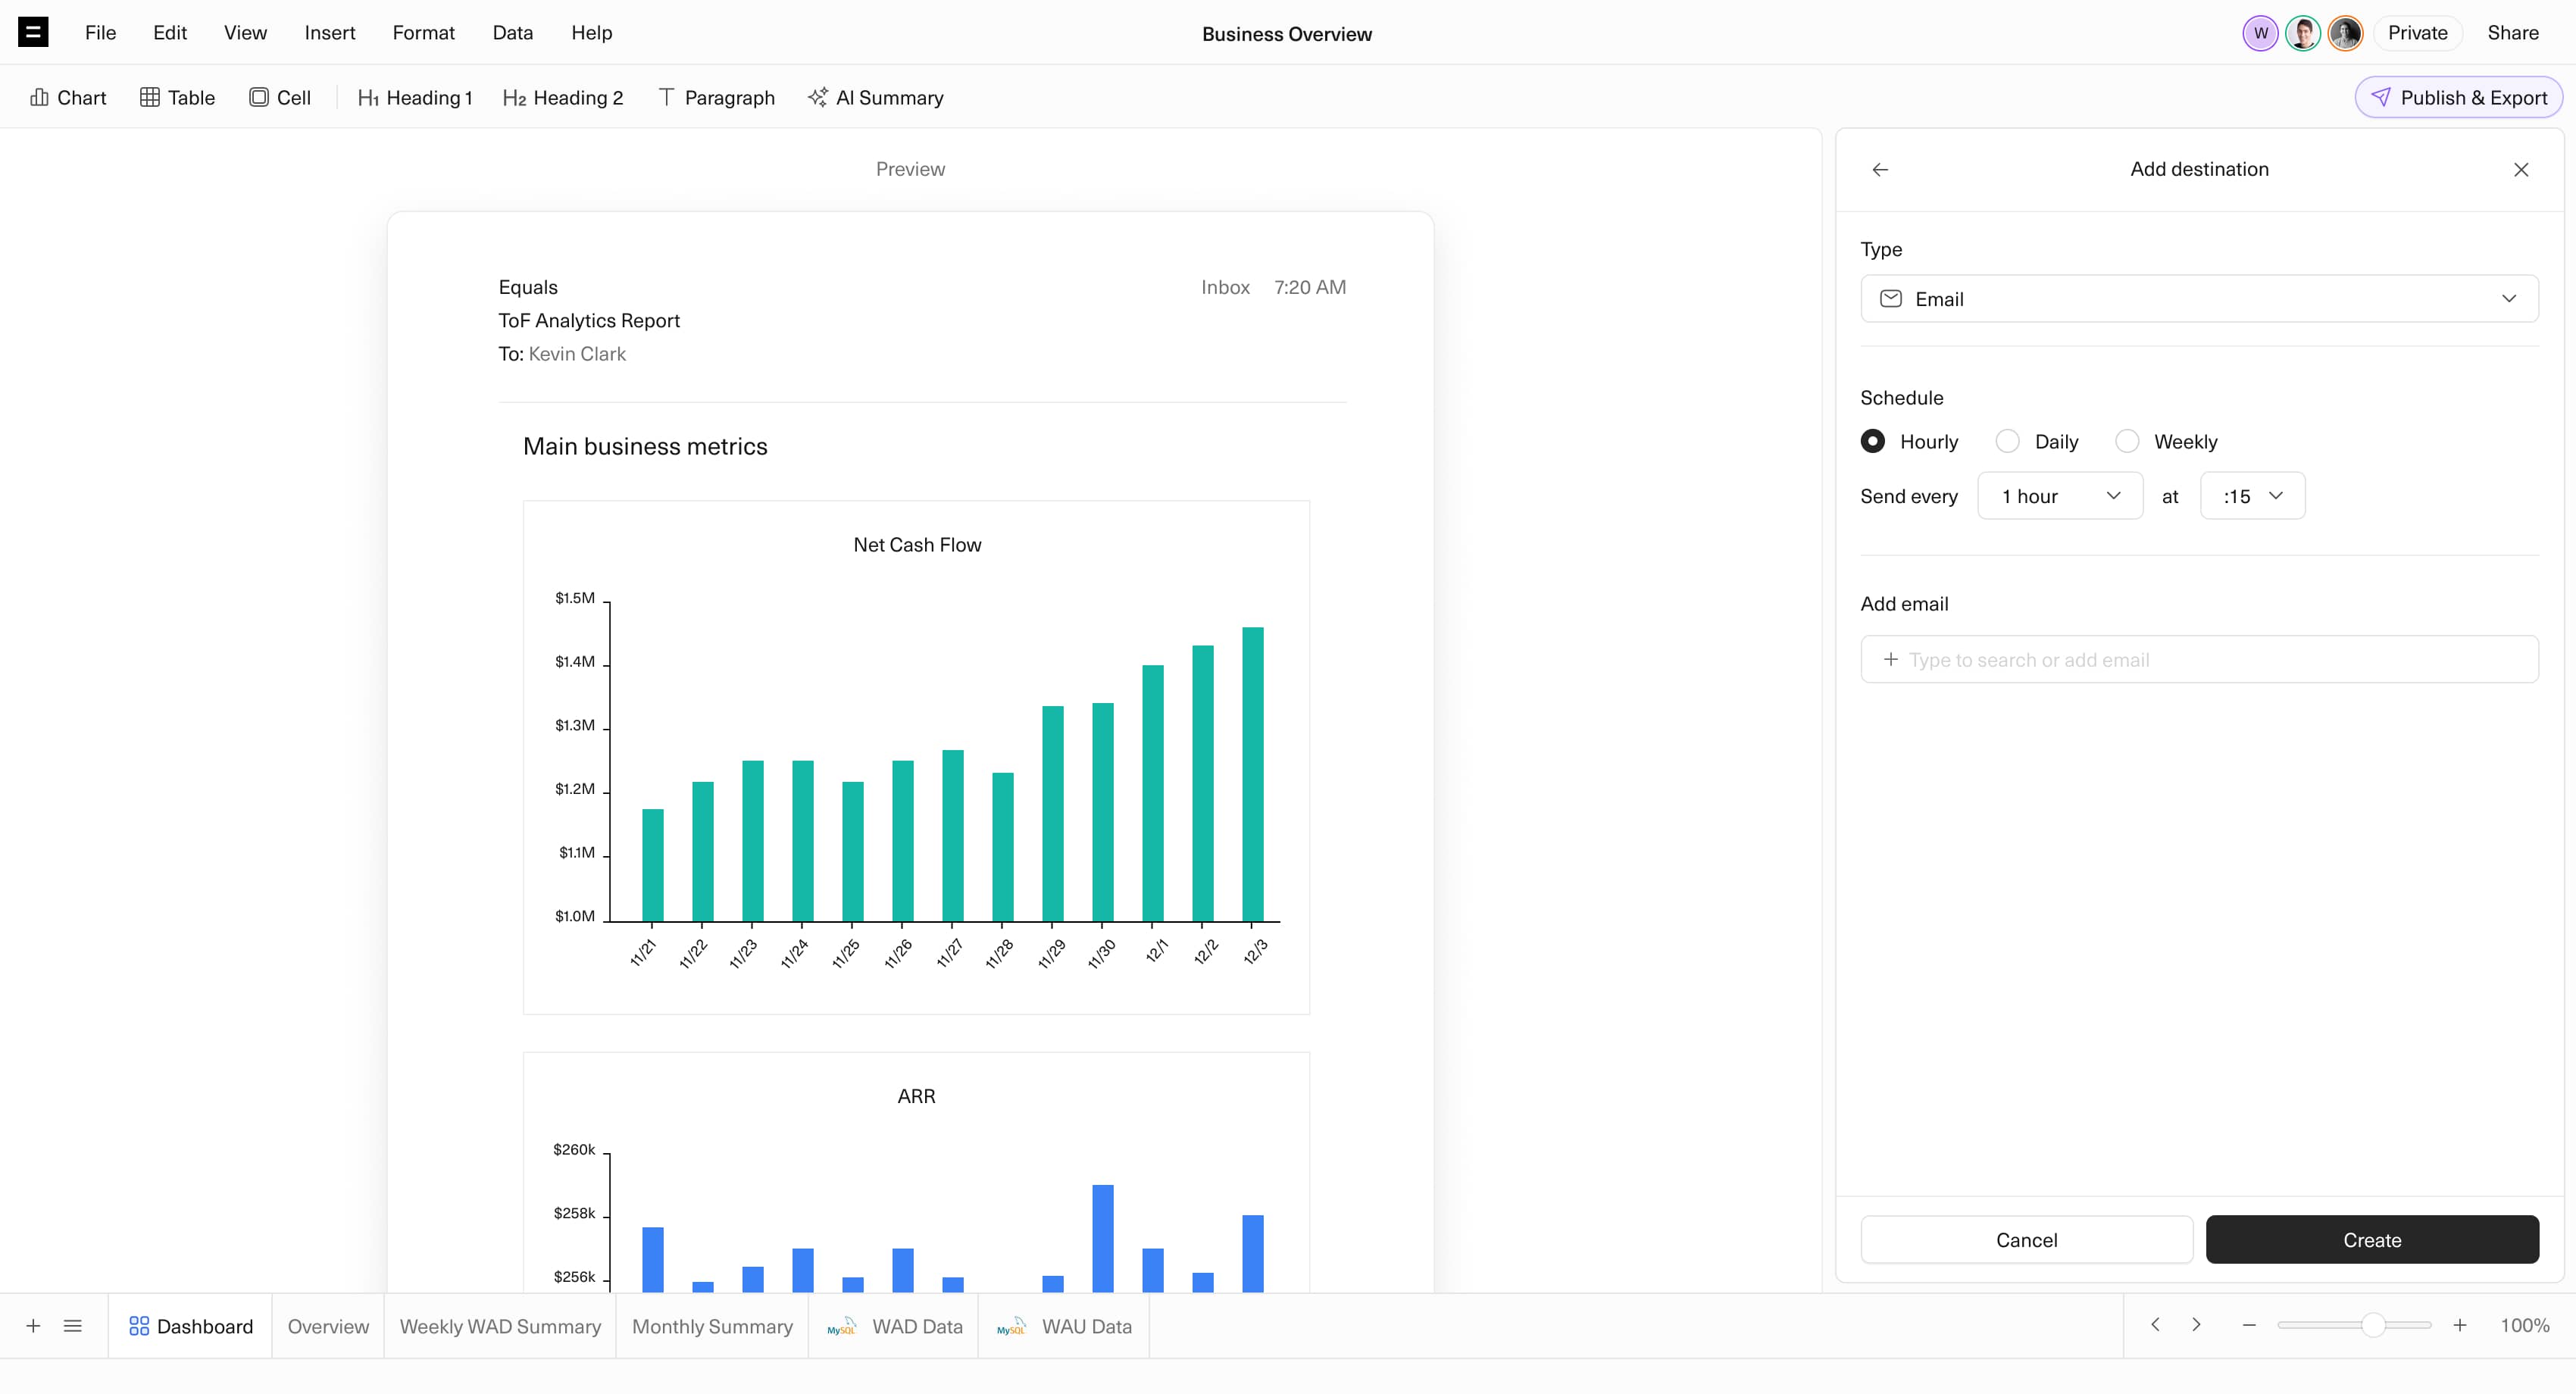
Send to Email
Auto-distribute the latest view of your dashboard to a specific email address on a defined schedule.
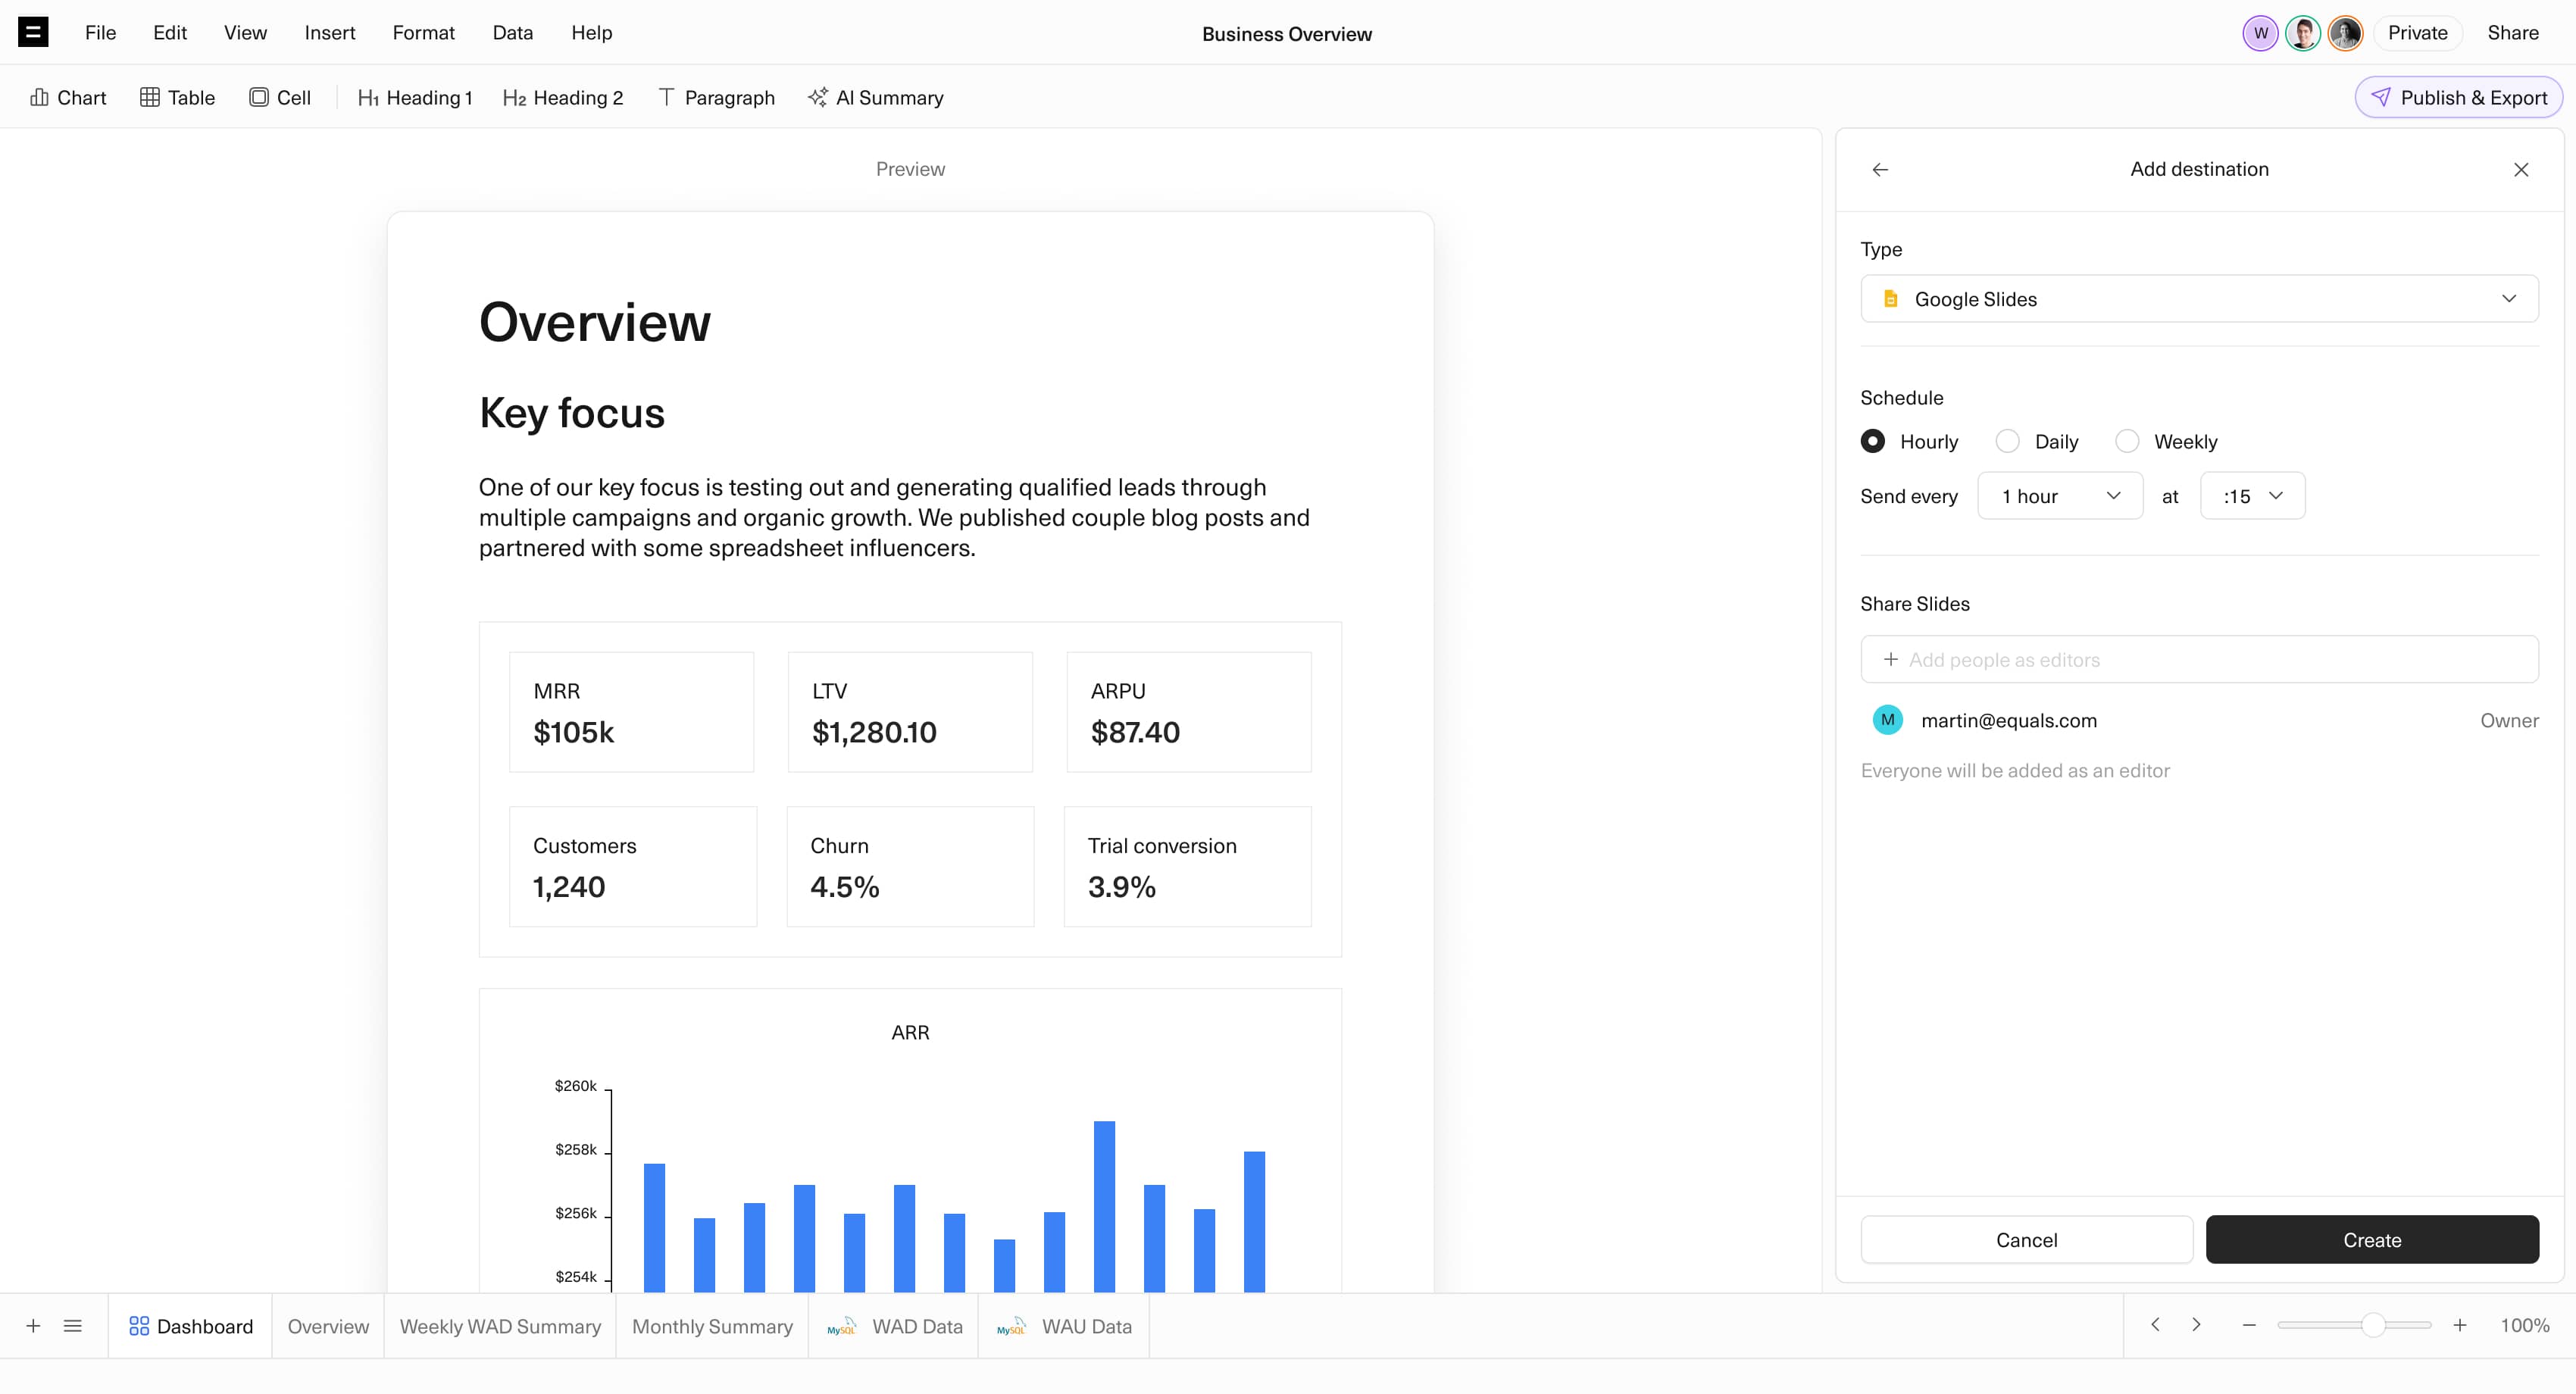
Create Slides
Generate a Google Slide deck of your dashboard every week, day or hour, so you don’t have to.
Dashboard Permissions
Control who has view and edit access to your workbook or just your dashboard.
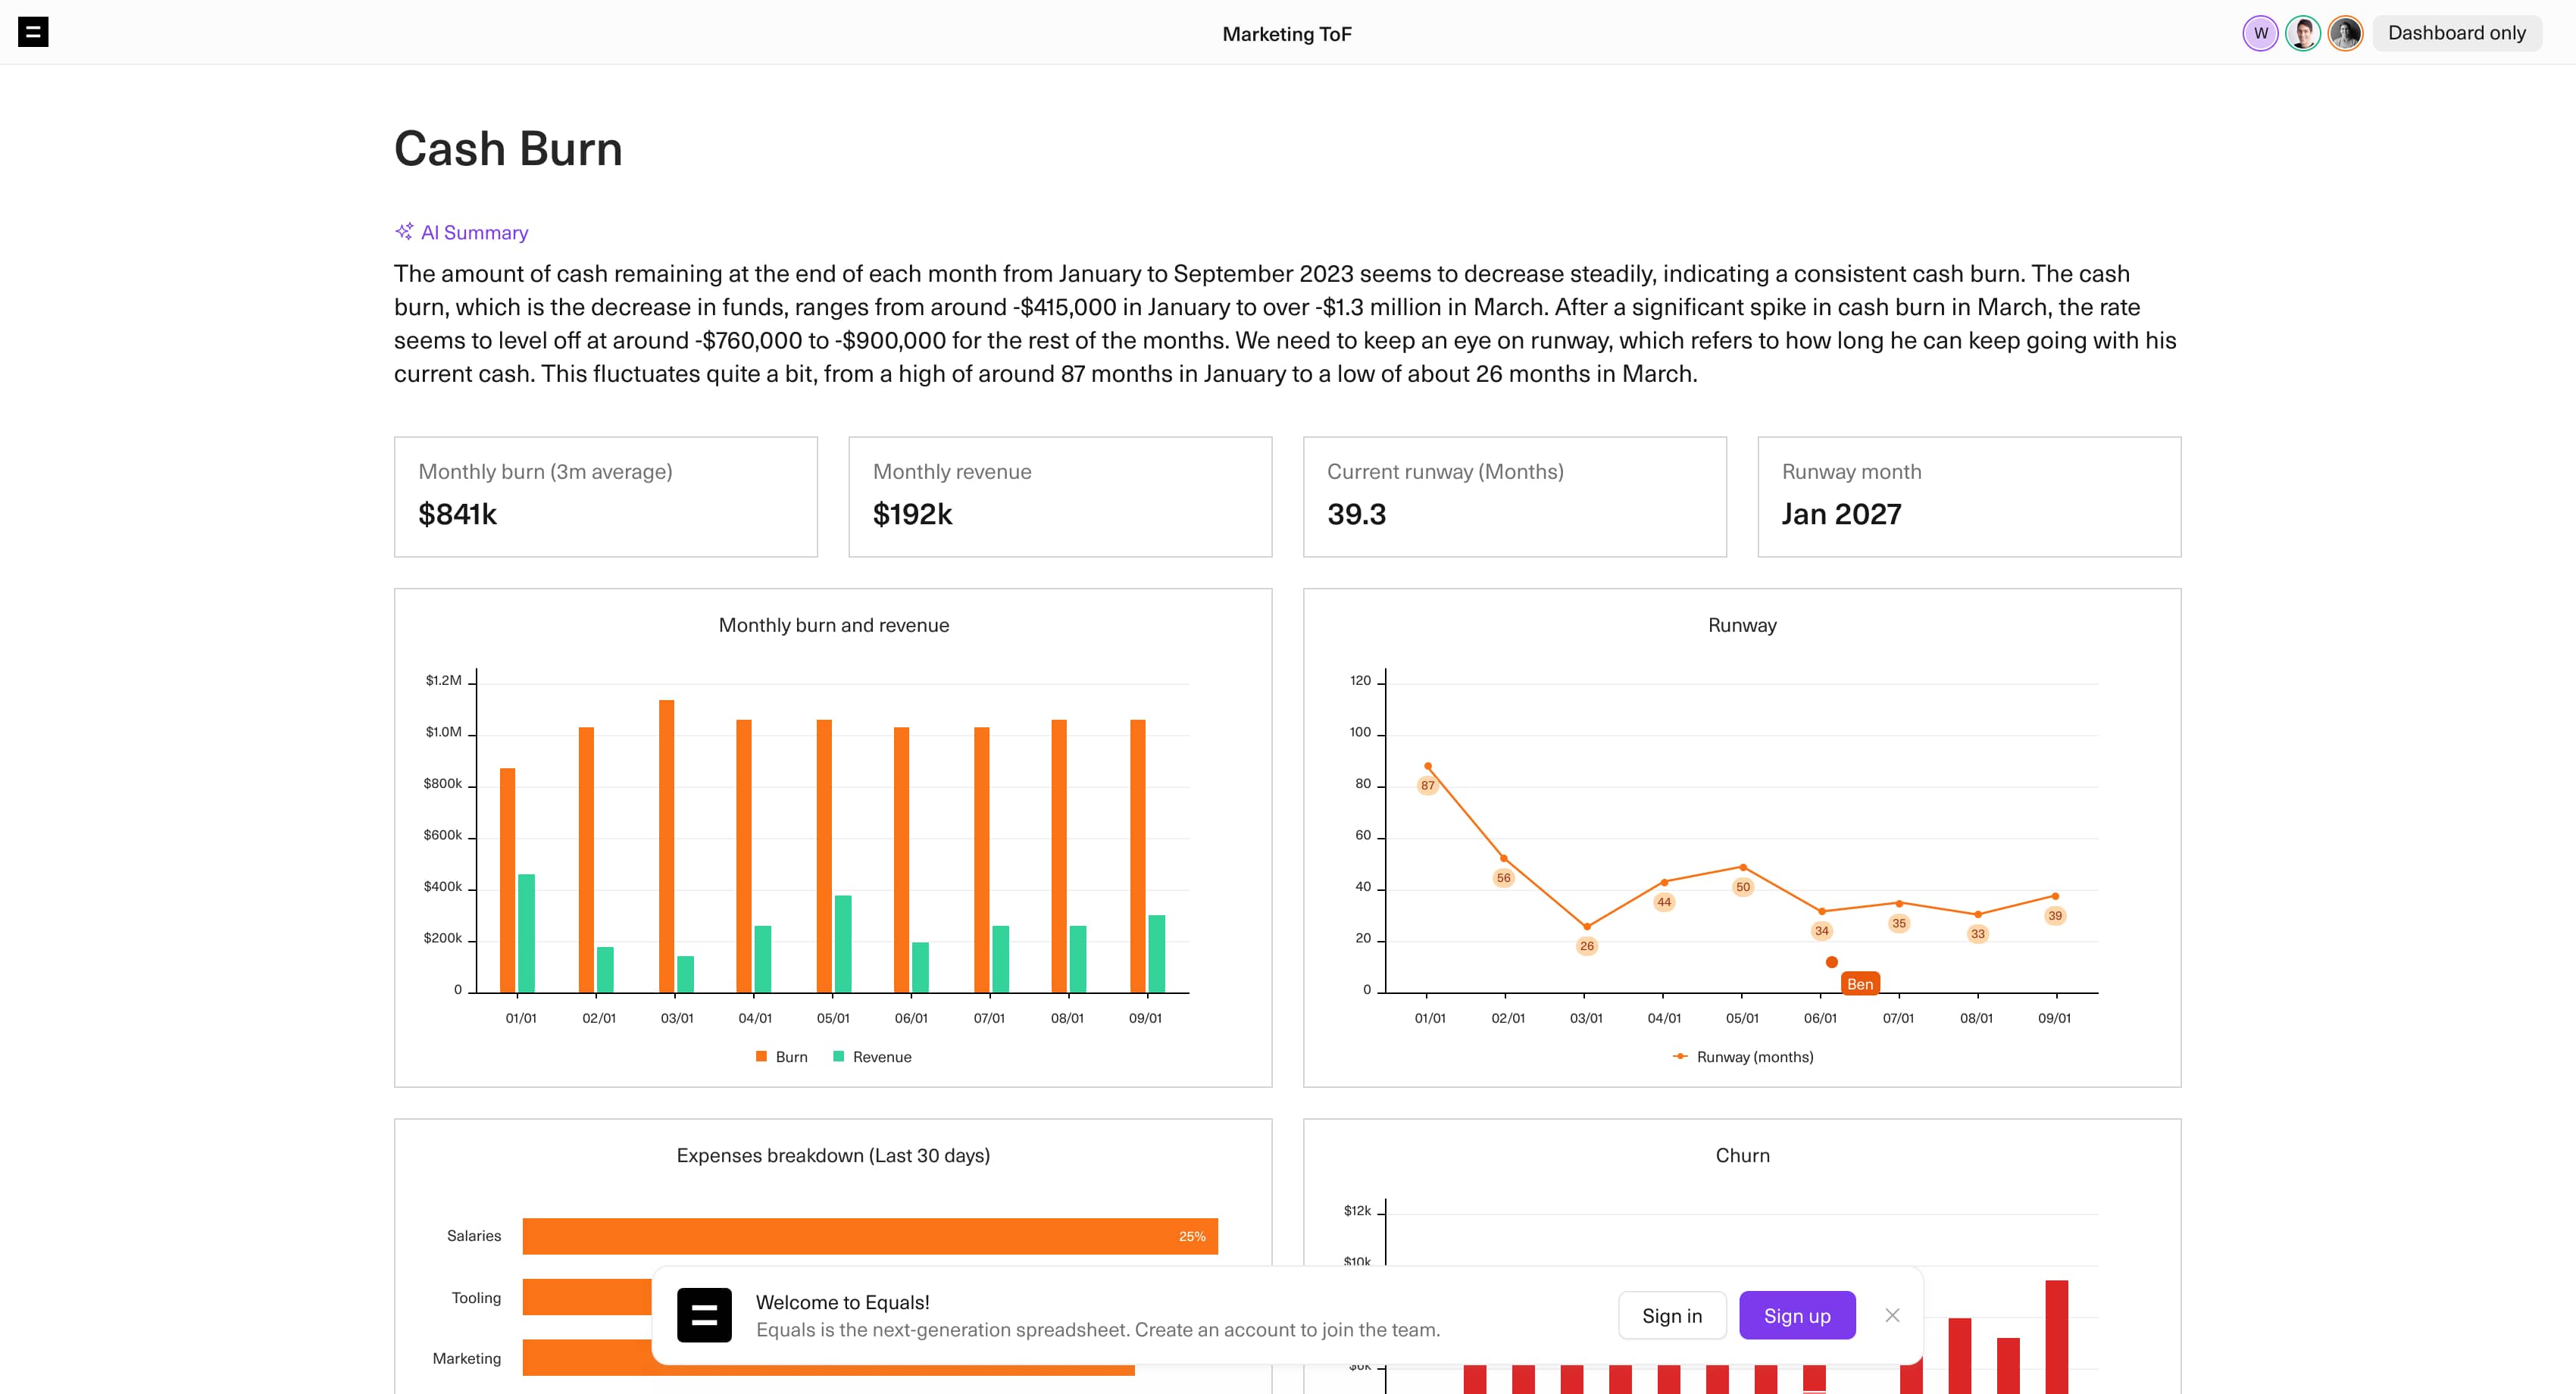
Anonymous Access
Enable anyone with the link to view your dashboard without needing to log in.
AI Assist
Tap in to the power of AI from your spreadsheet. From blank sheet to insight — all you have to do is ask.
Learn More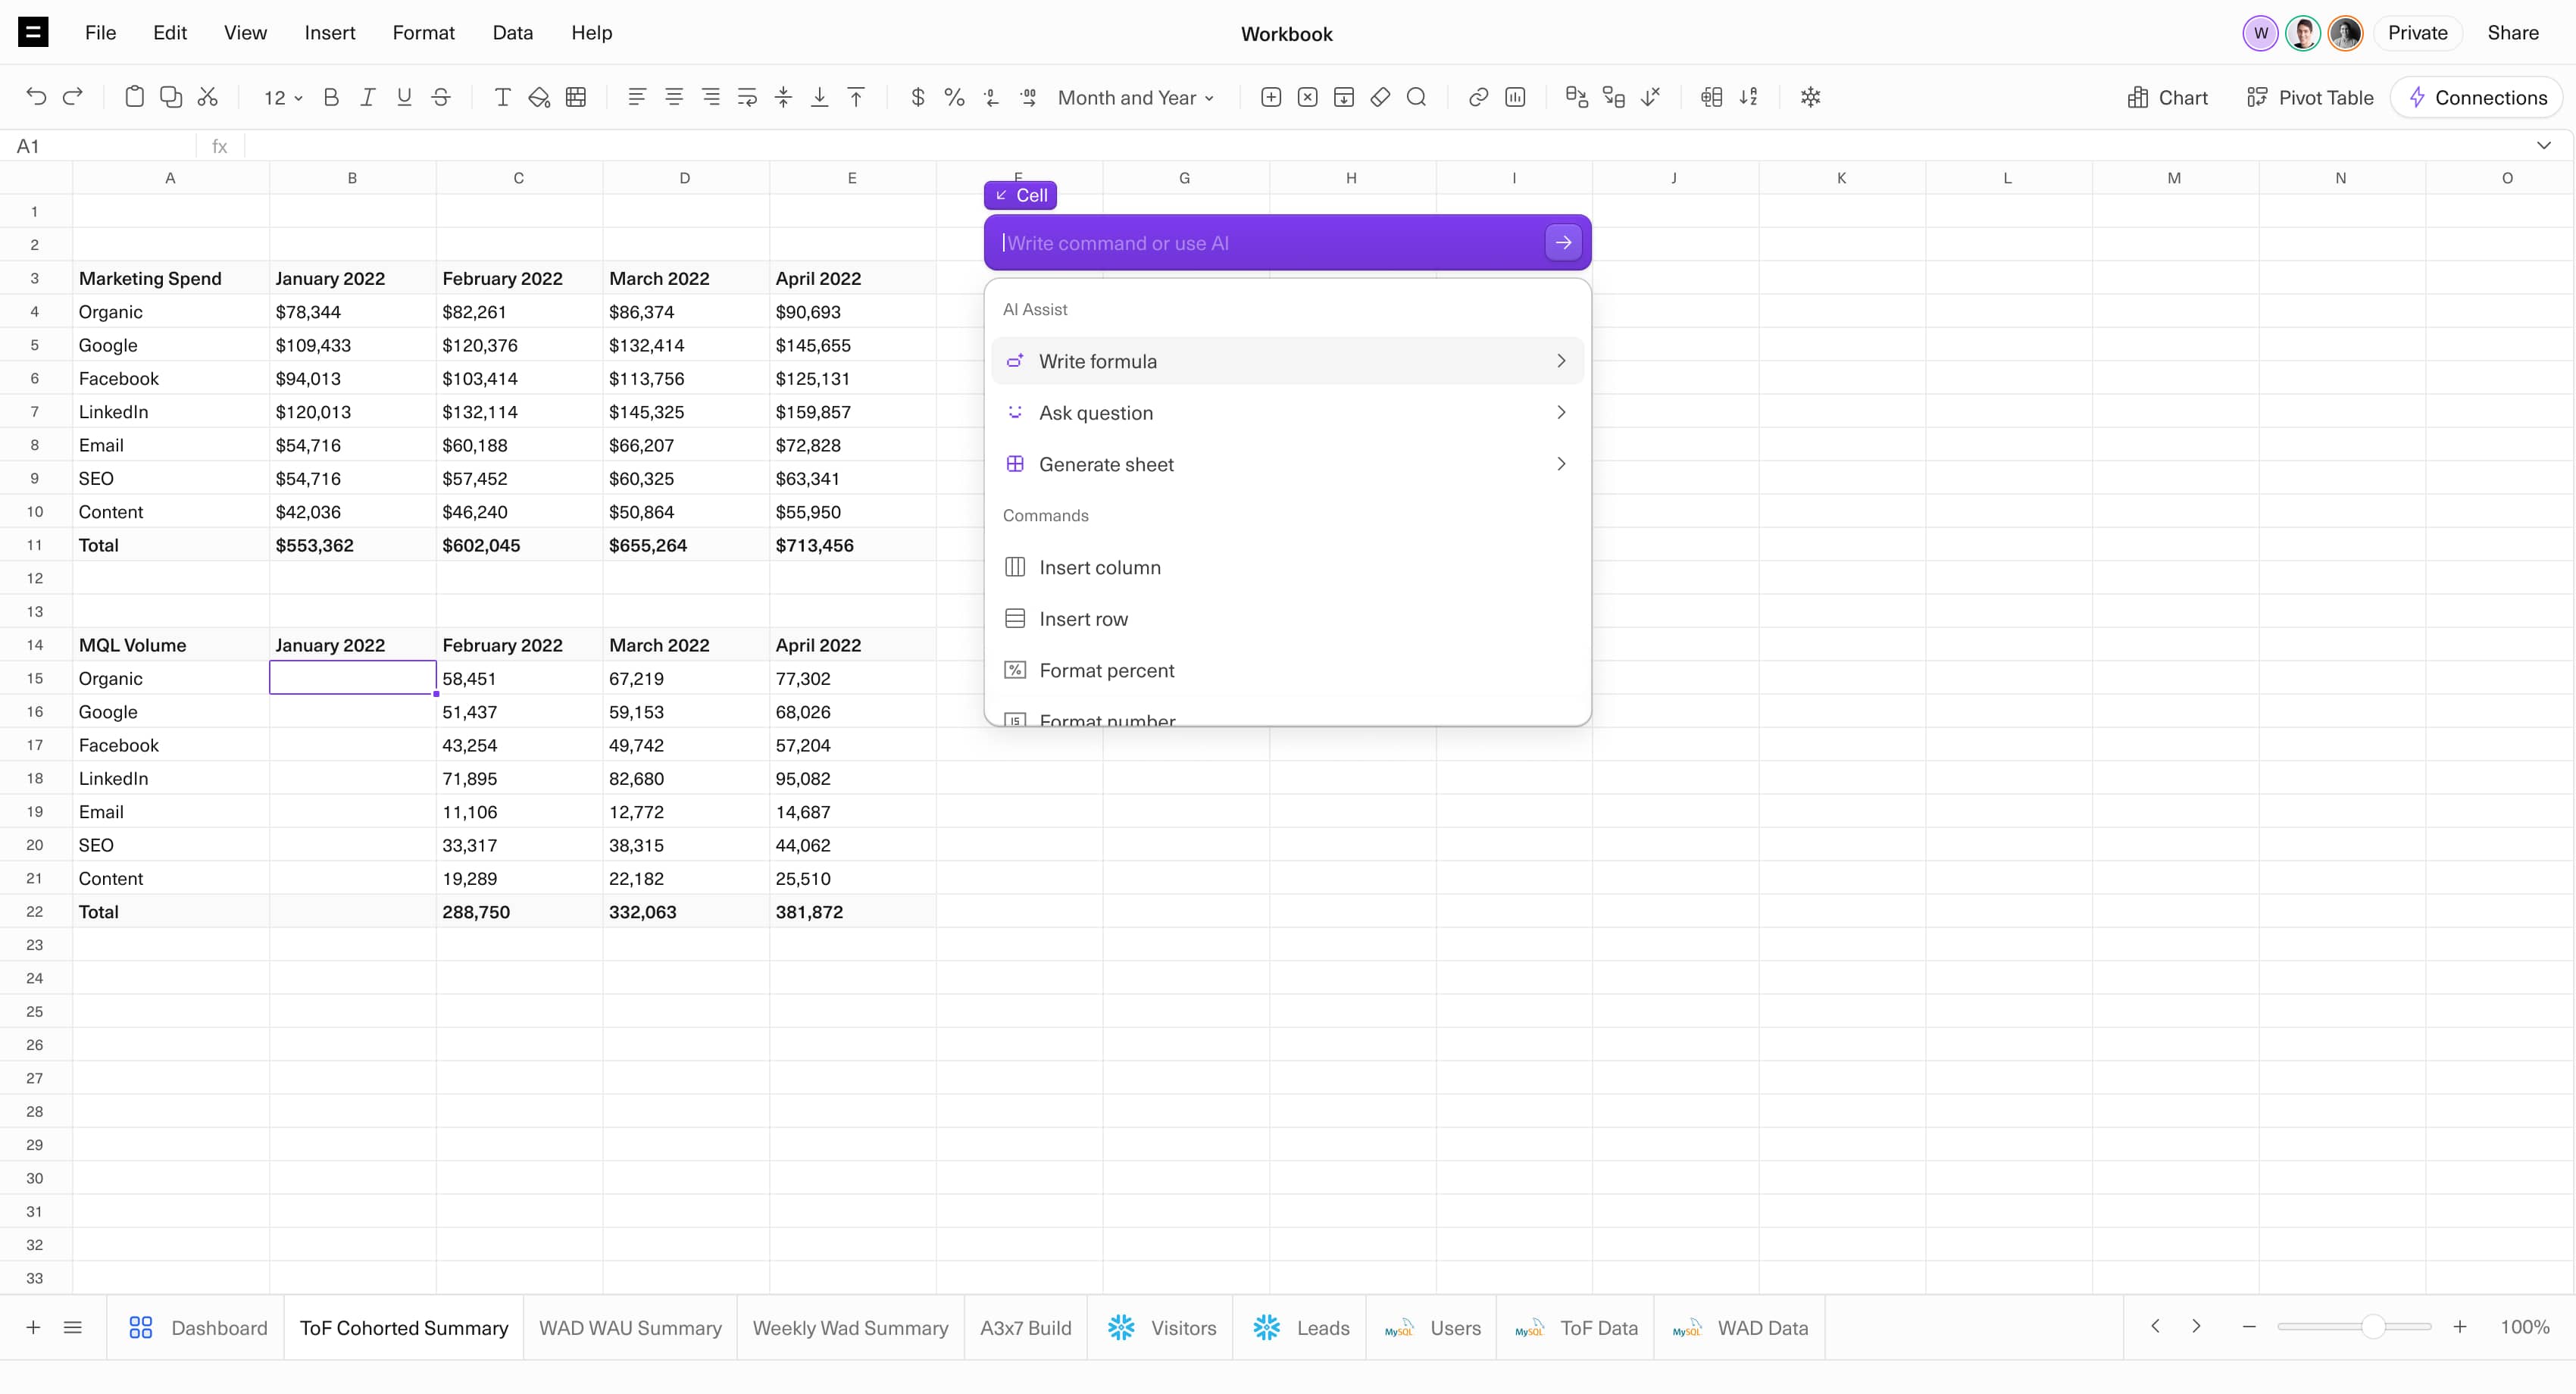
Write
Generate formulas and queries tailored to the context of your workbook and datasources.
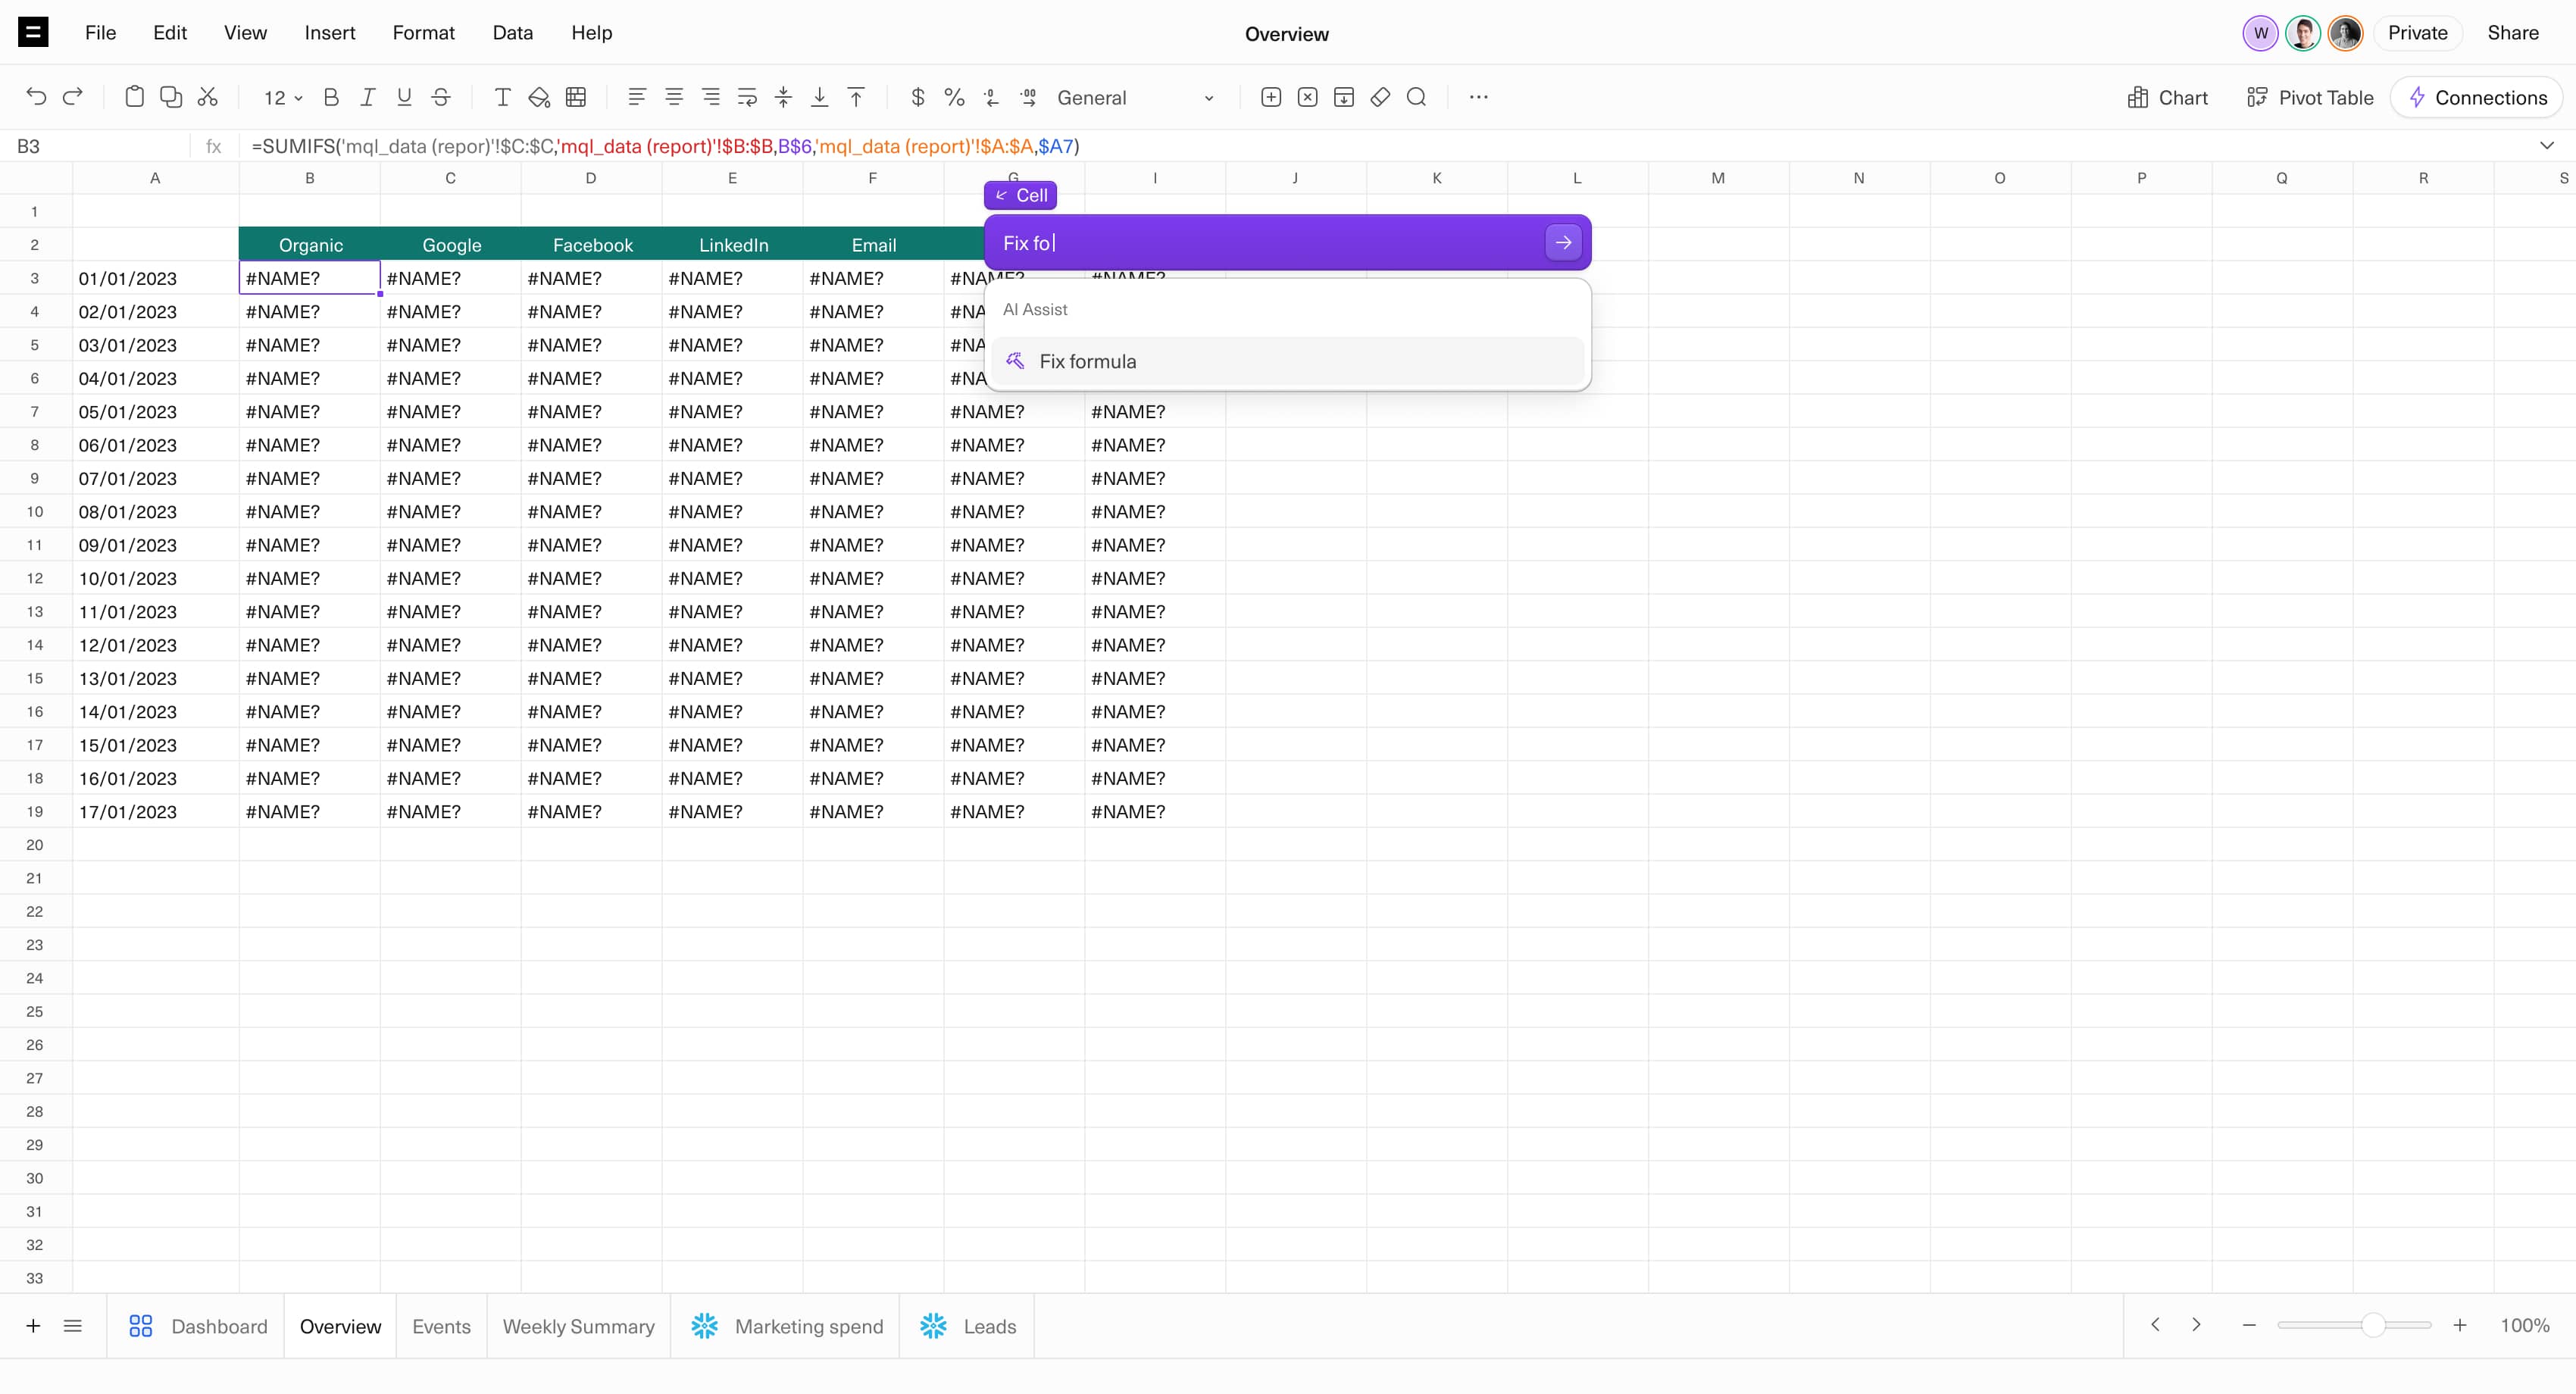
Debug
Apply fixes for broken formulas and queries.
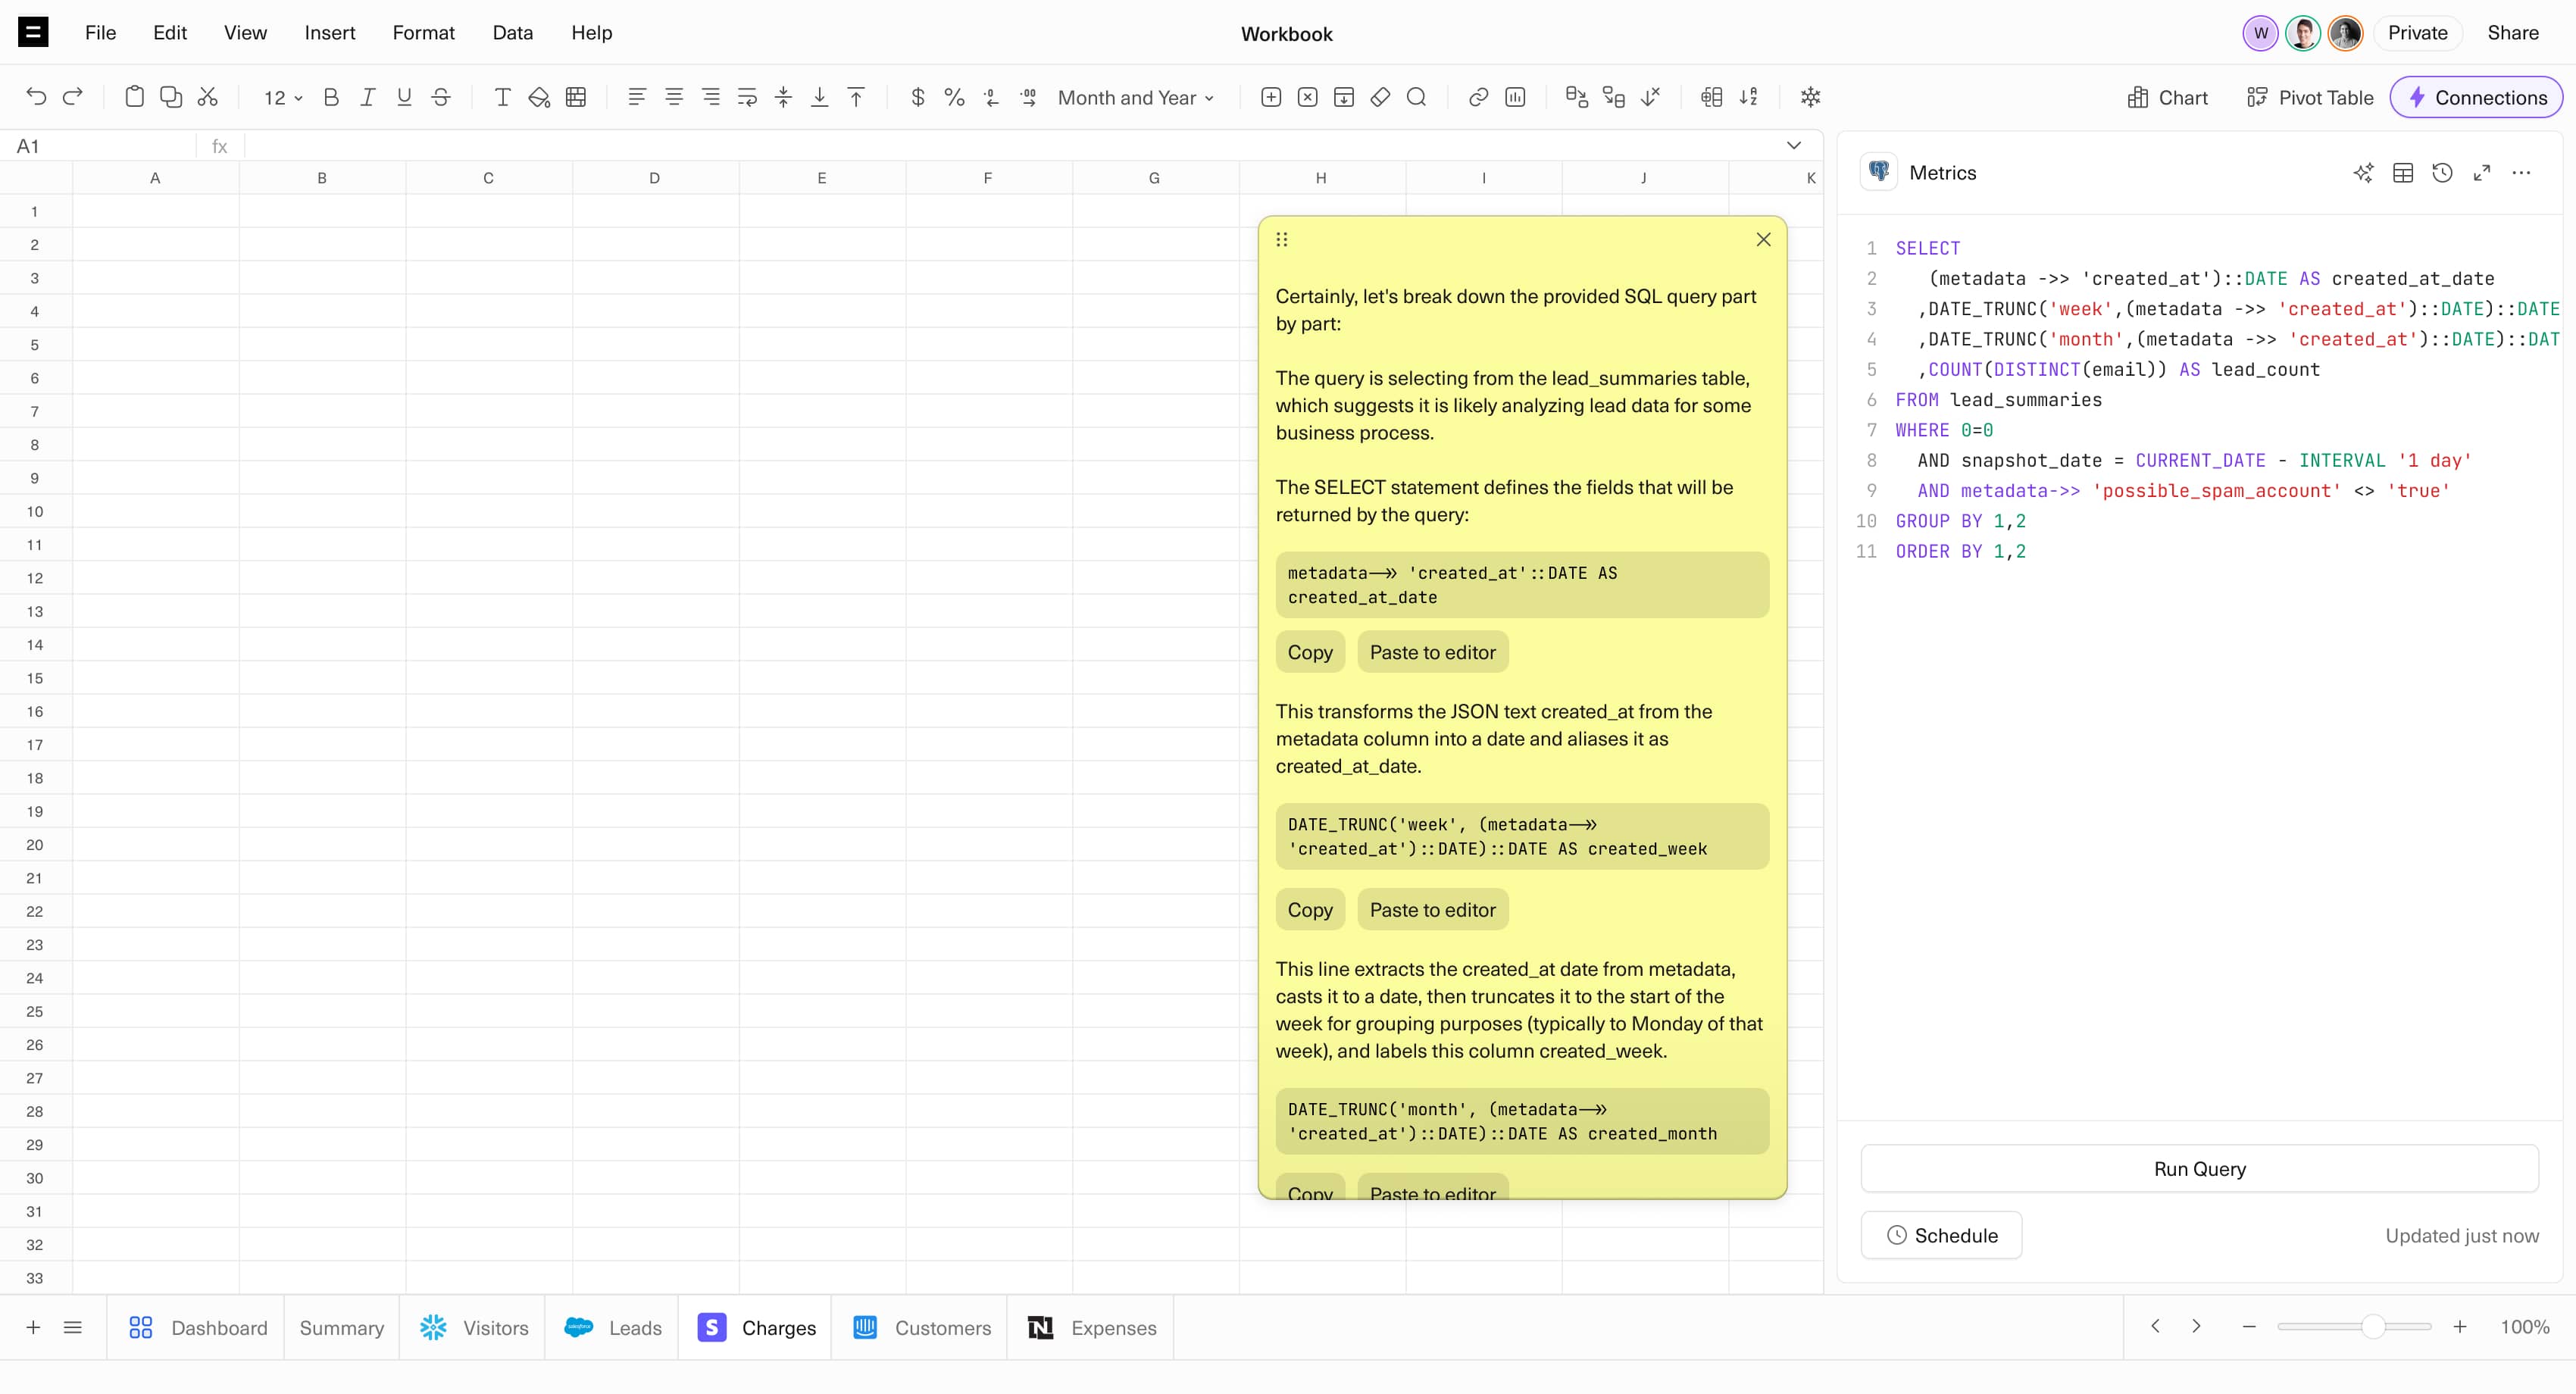
Explain
Generate a breakdown of how a formula or query works, and derive takeaways from charts.
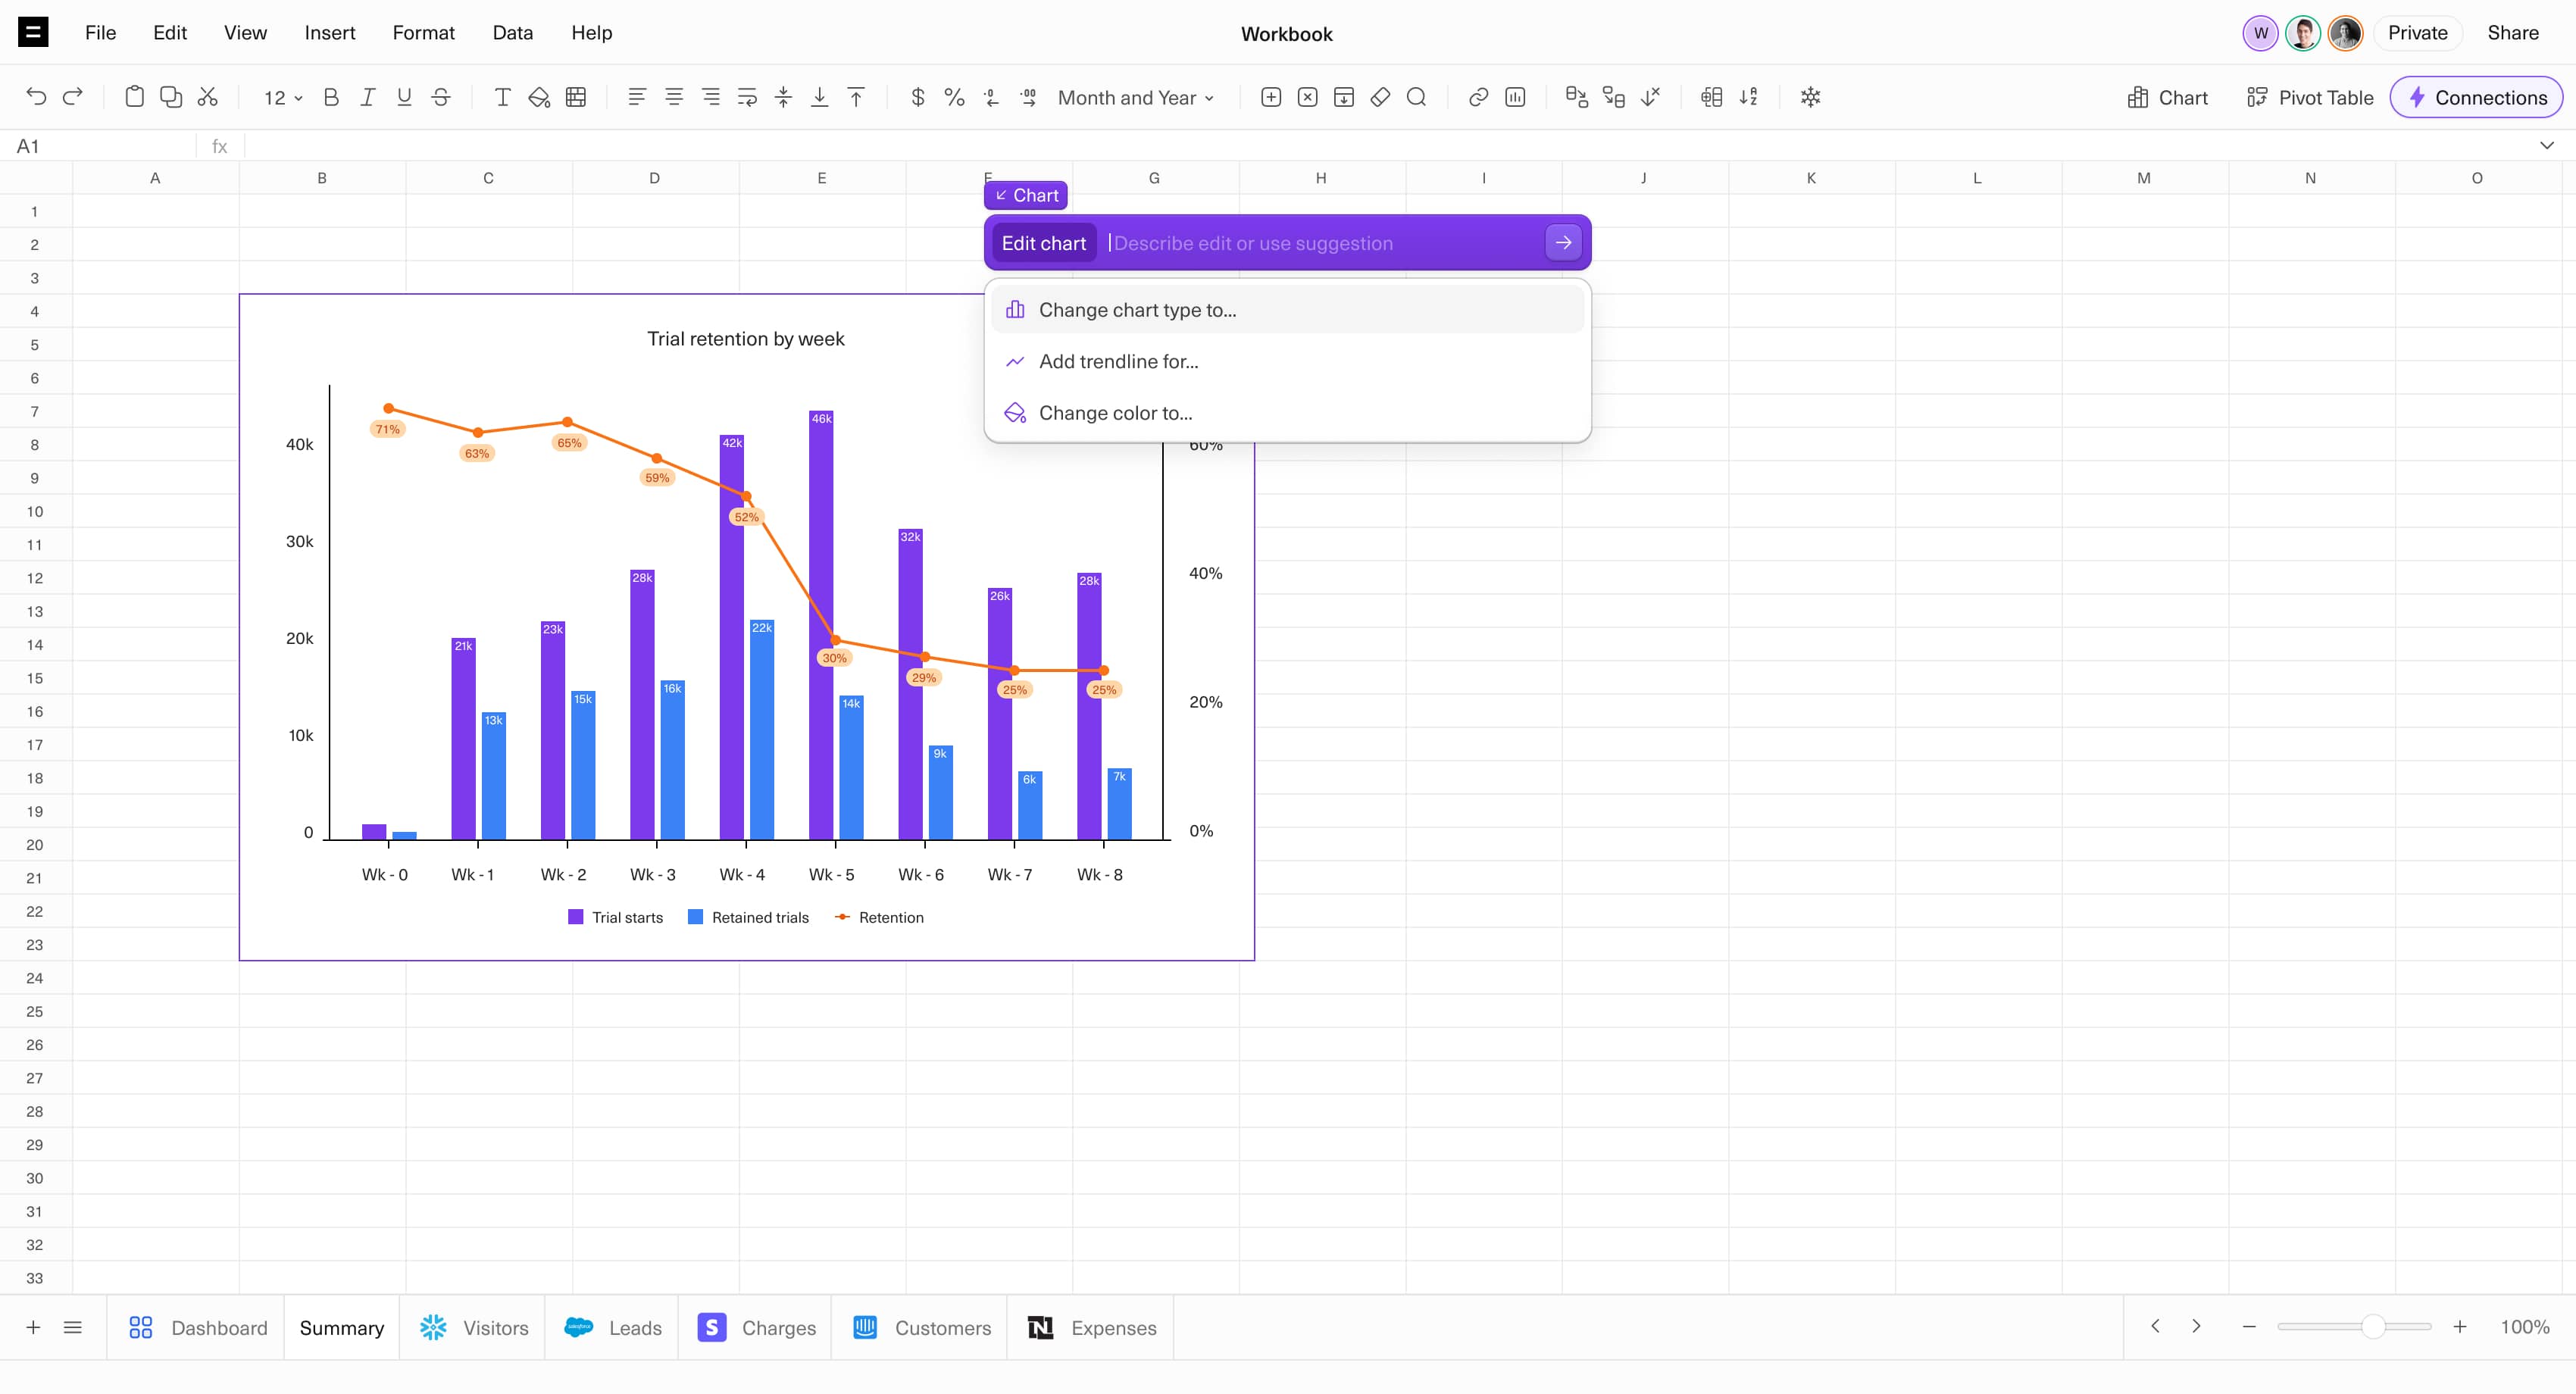
Visualize
Customize charts with natural language prompts.
Generate Dashboard
Create a dashboard that auto-organizes and summarizes analyses in your spreadsheet.
